Optimization Project Portfolio for a Railway Company
This project presents a framework for building an optimization project portfolio for a railway company based on customer journey mapping, continuous improvement, and cross-functional idea validation.
Download PDF presentation
📌 Overview
This project focused on designing an optimization project portfolio for a large railway freight company by translating customer pain points into structured improvement initiatives. The portfolio was built on top of customer journey mapping, internal expert input, and a continuous improvement cycle that moved from discovery to idea generation, prioritization, and implementation.
The goal was not simply to document customer issues, but to turn them into a decision-ready portfolio of operational and strategic projects aligned with commercial performance, customer loyalty, and long-term business goals.
👤 My Role
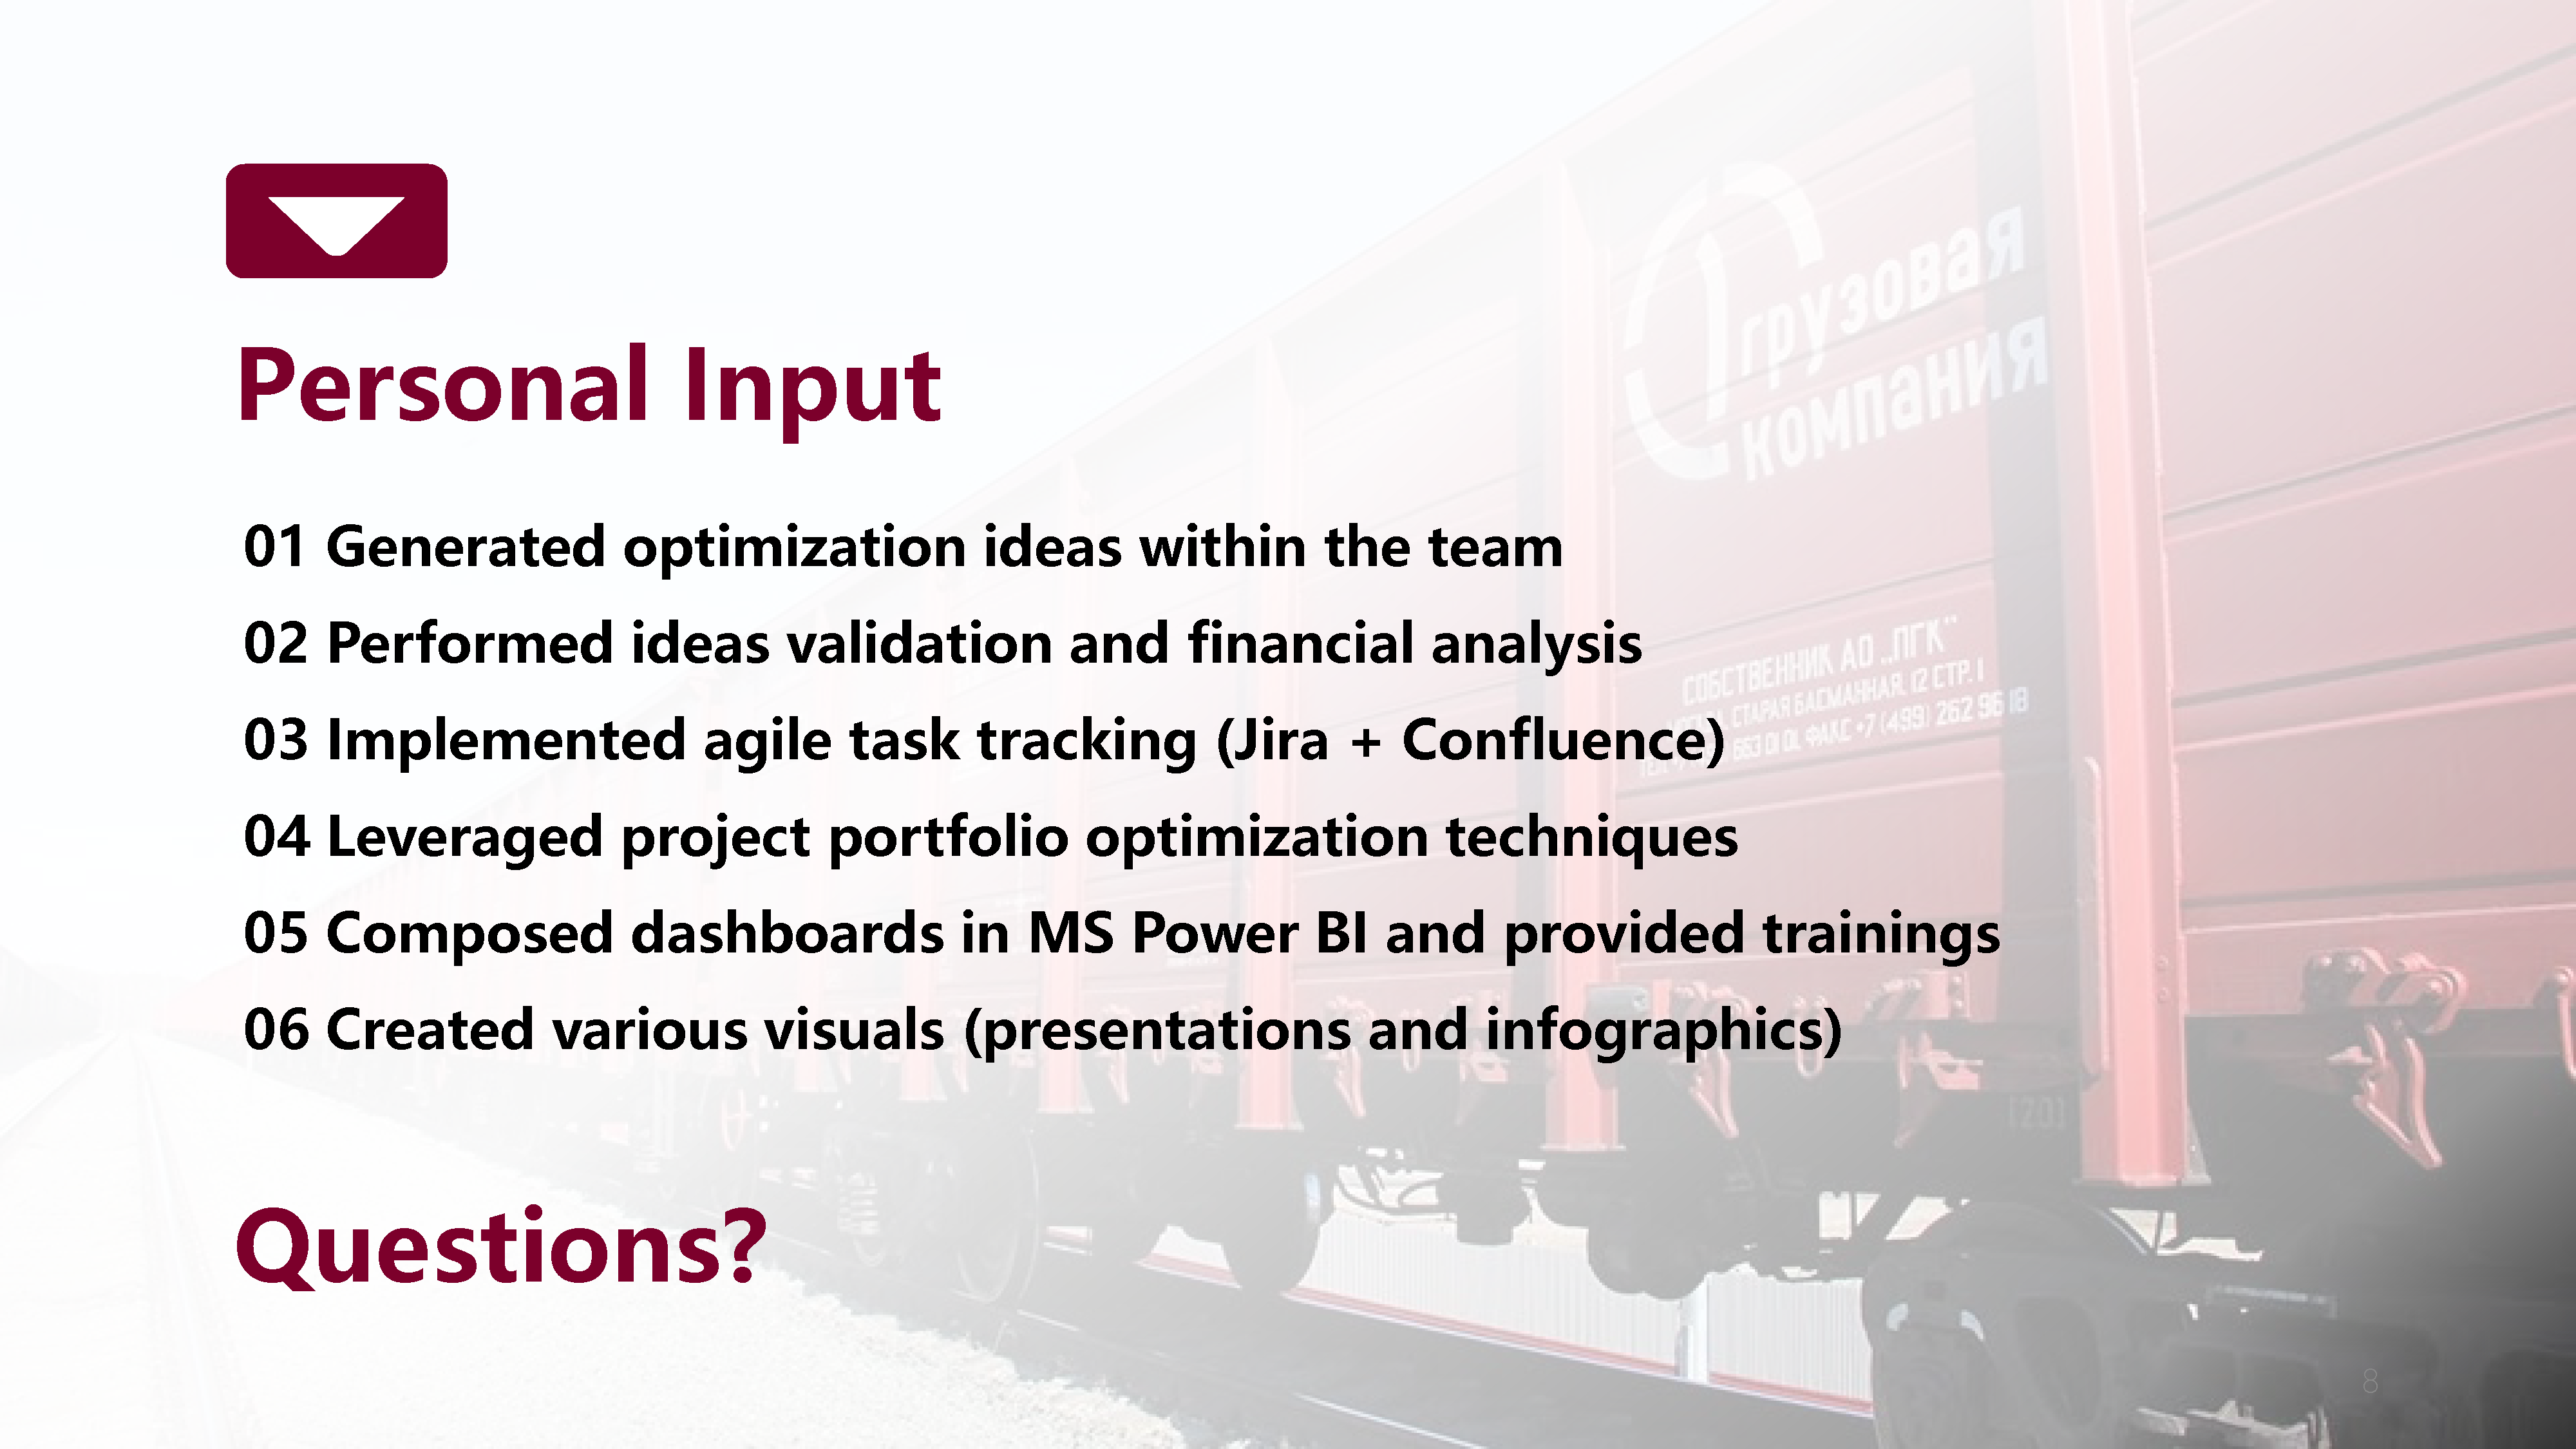
I contributed to the initiative across both analytical and implementation dimensions. My work included generating optimization ideas within the team, validating ideas through analysis, performing financial assessment, implementing agile task tracking through Jira and Confluence, applying project portfolio optimization techniques, building Power BI dashboards, conducting trainings, and creating supporting visuals such as presentations and infographics.
🎯 Business Context
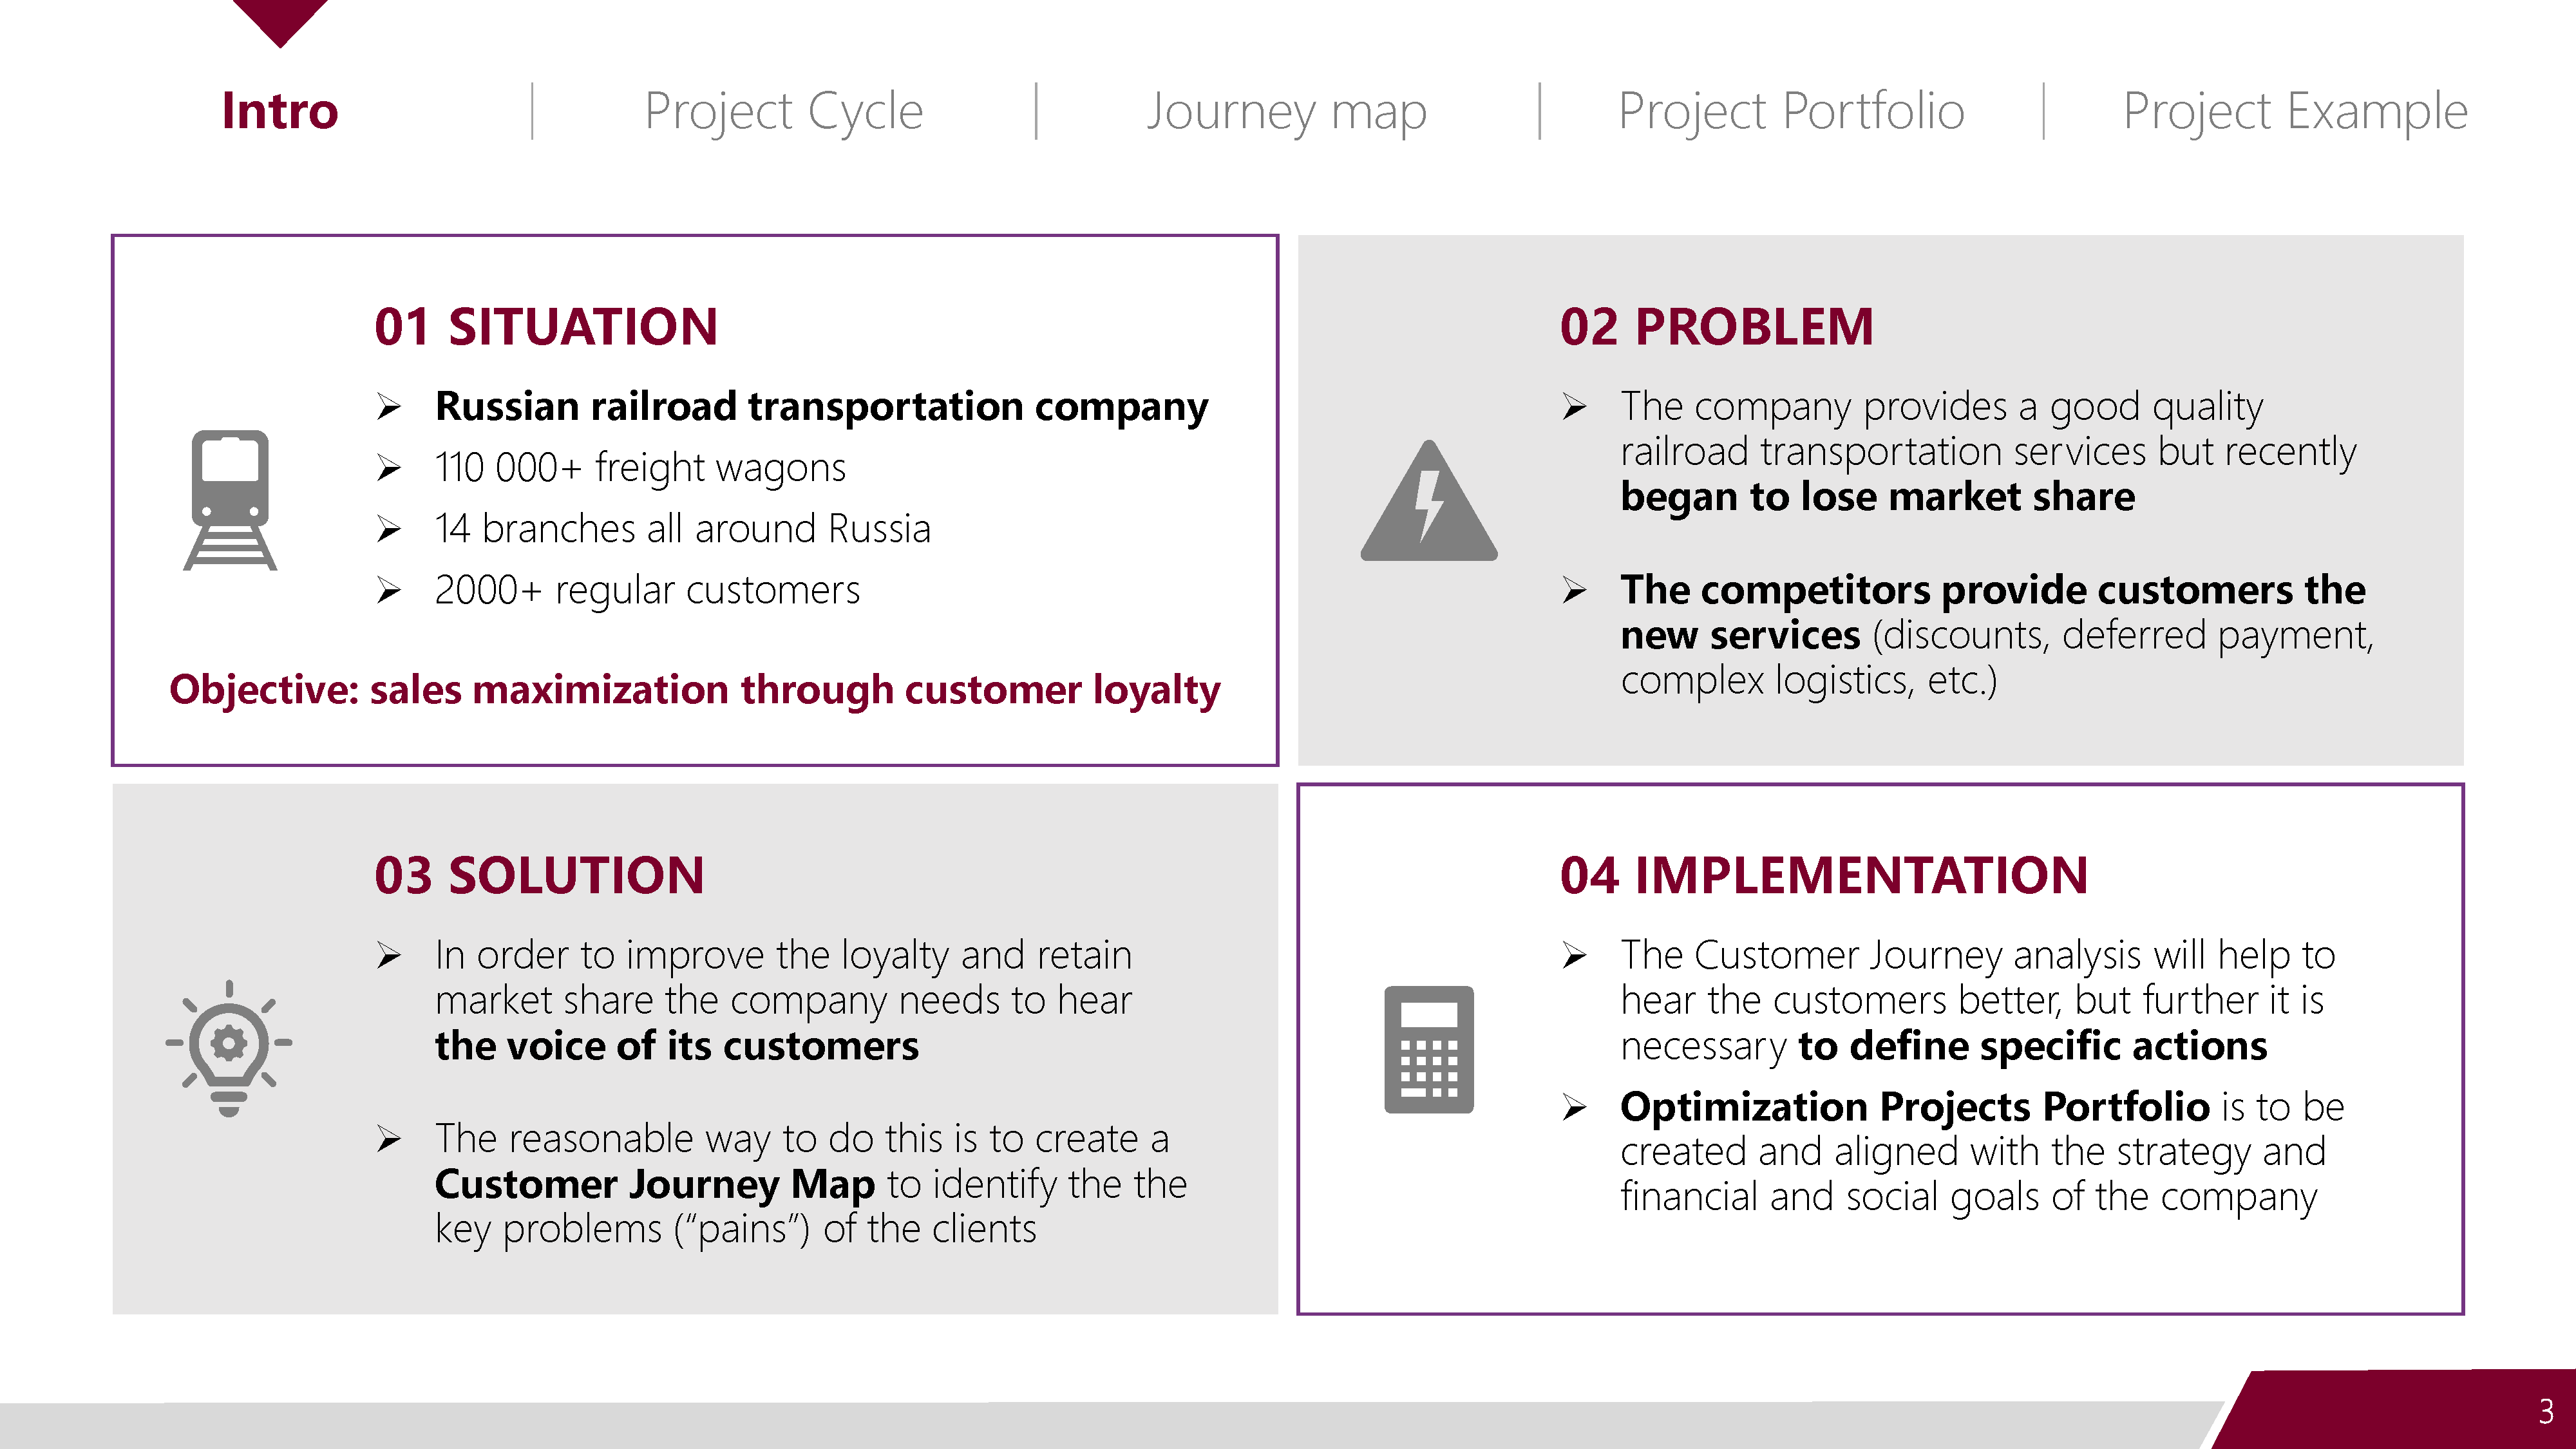
The company was a major Russian railway freight operator with more than 110,000 freight wagons, 14 branches across the country, and over 2,000 regular customers.
Although the company delivered strong core transportation services, it had started to lose market share as competitors introduced additional customer-oriented offerings such as discounts, deferred payment options, and more complex logistics services. The business therefore needed a structured way to hear the voice of customers, identify the main service gaps, and convert those insights into targeted improvement projects.
🛠️ Tool Stack
Customer journey mapping, project portfolio management, continuous improvement methods, customer development interviews, financial analysis, Power BI, Jira, Confluence, dashboards, presentations, and infographics.
🧭 Methodology
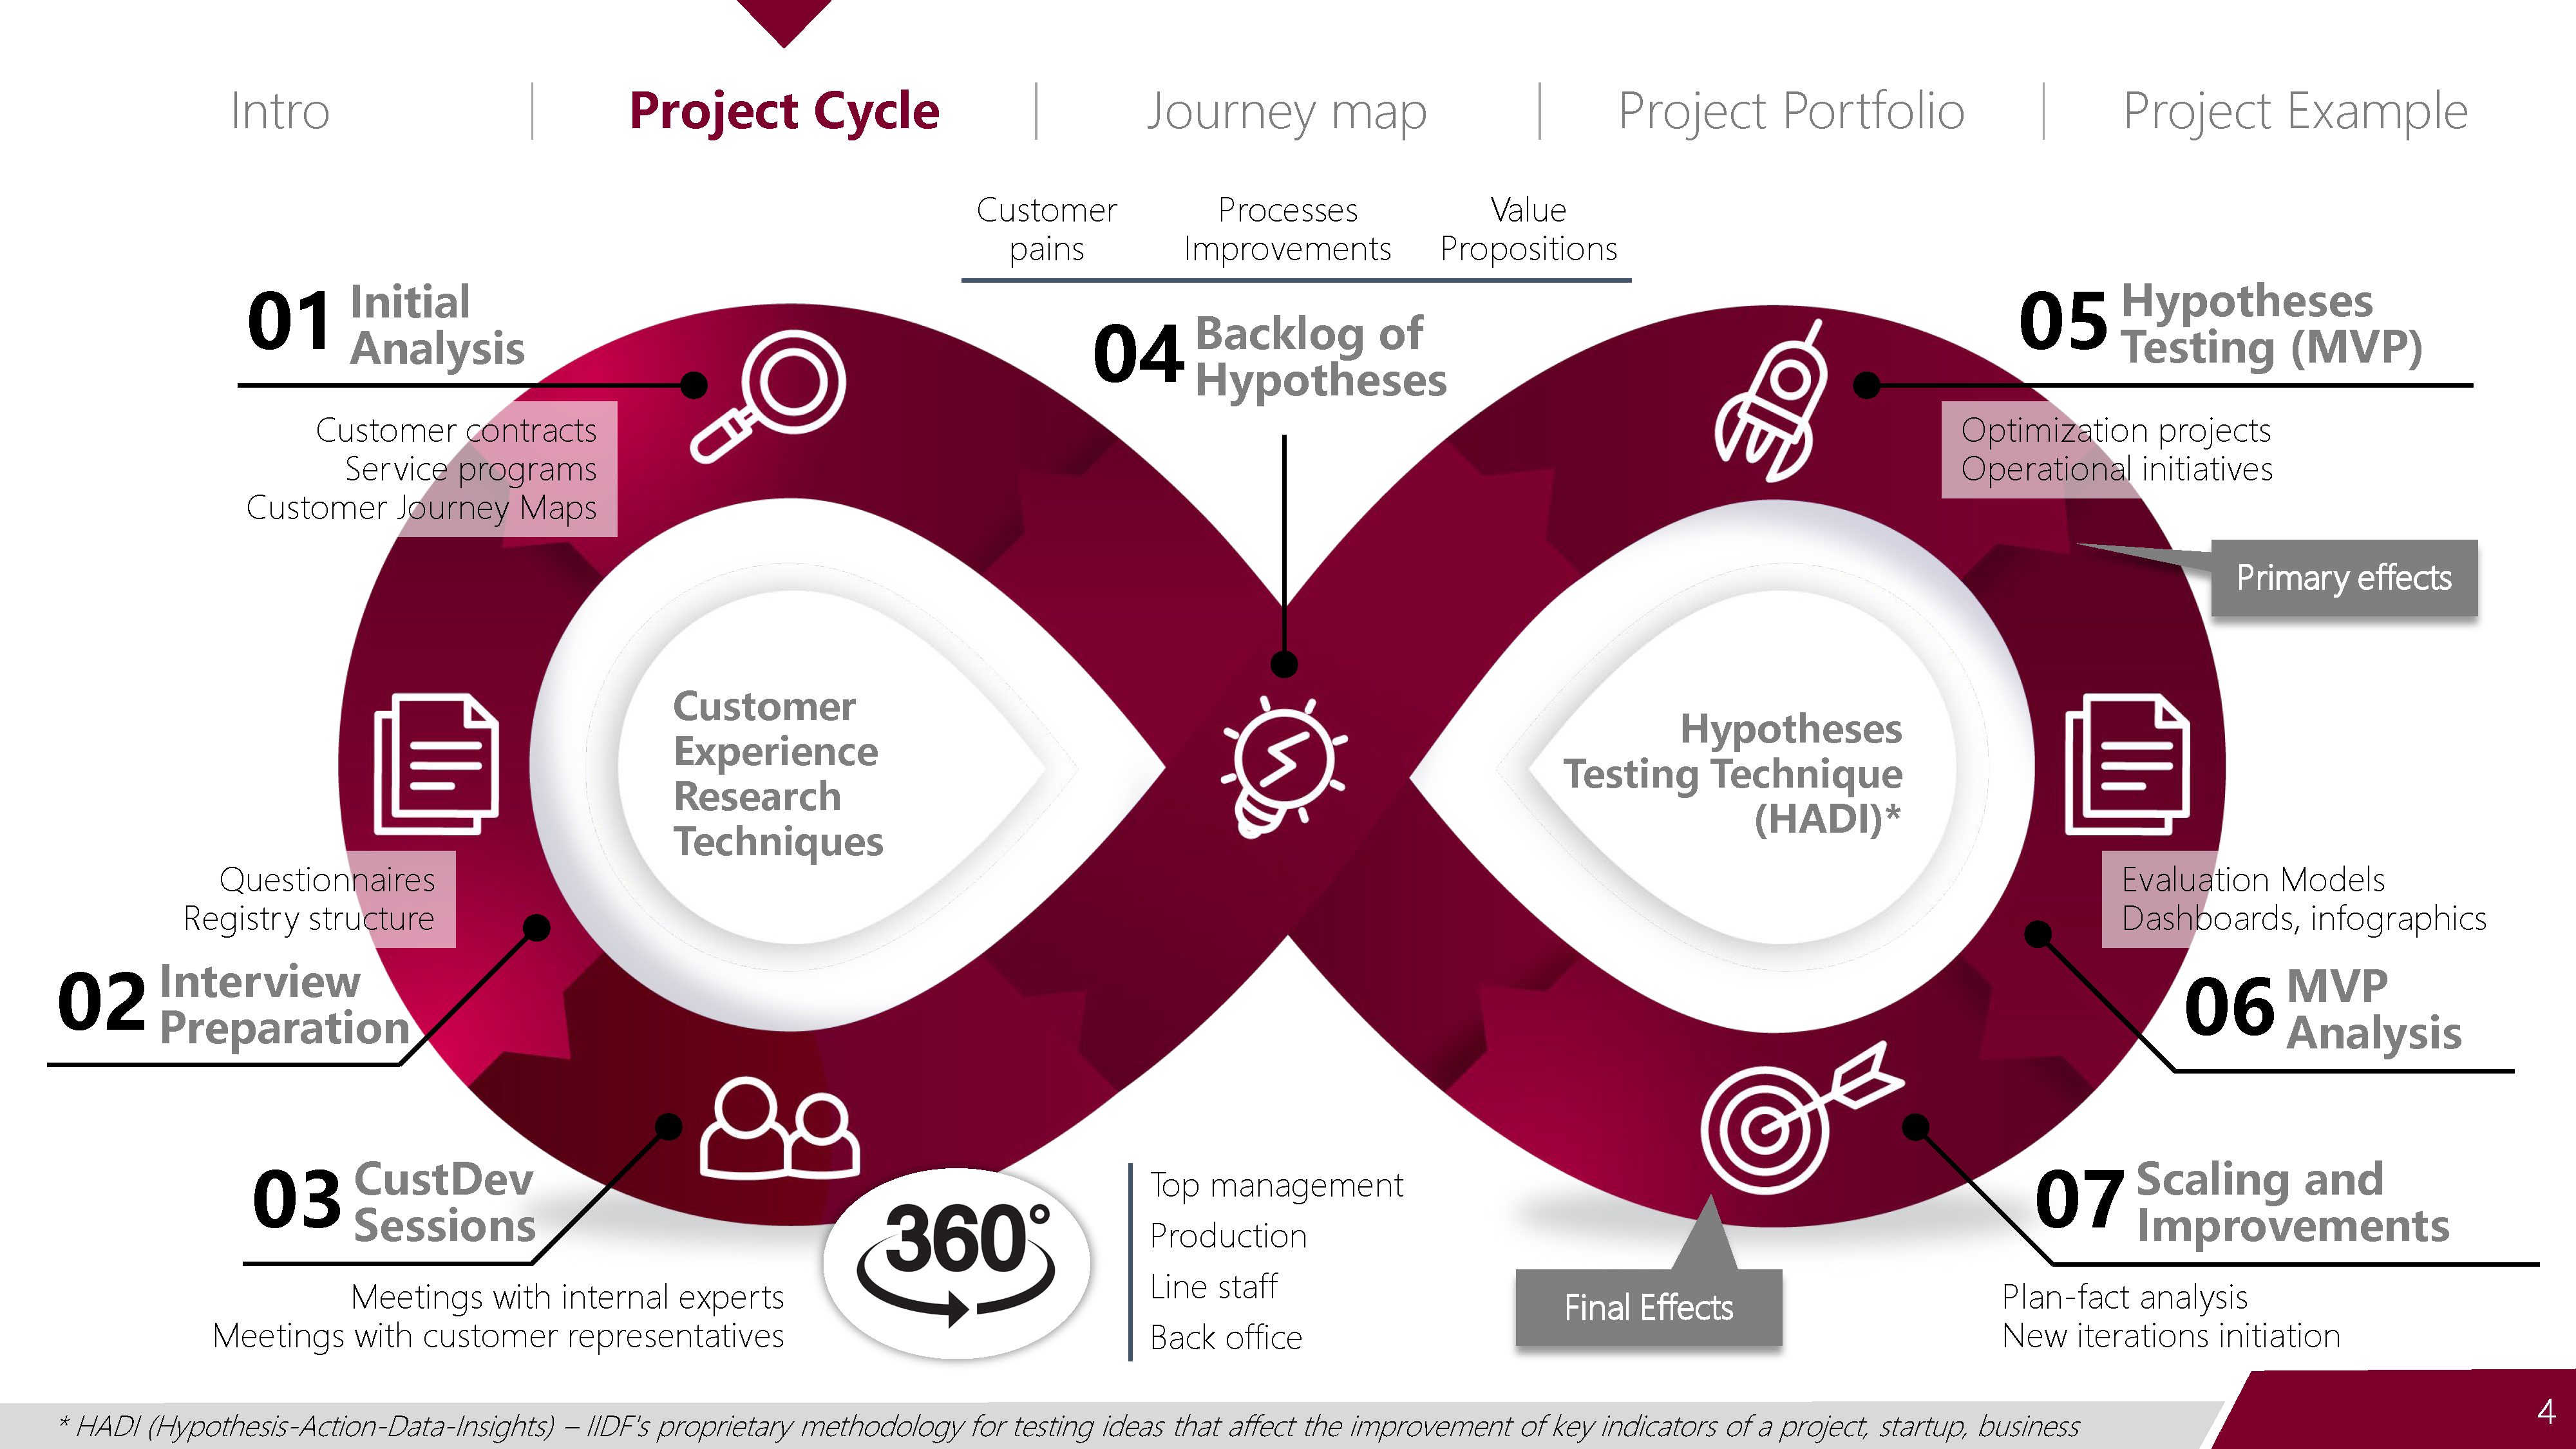
The overall logic of the project was built as a continuous improvement cycle.
The process started with analysis of existing materials such as customer contracts, service programs, and journey maps. That was followed by interview preparation, customer development sessions, and meetings with both internal experts and customer representatives. The resulting customer pains, process improvement opportunities, and value propositions were then turned into a backlog of hypotheses.
These hypotheses were tested through MVP-style initiatives and operational improvement projects, then evaluated through dashboards, infographics, and analytical models. The cycle was designed to continue through plan-fact analysis, scaling, and new improvement iterations rather than ending with a single presentation or one-time recommendation set.
🗺️ Customer Journey Mapping
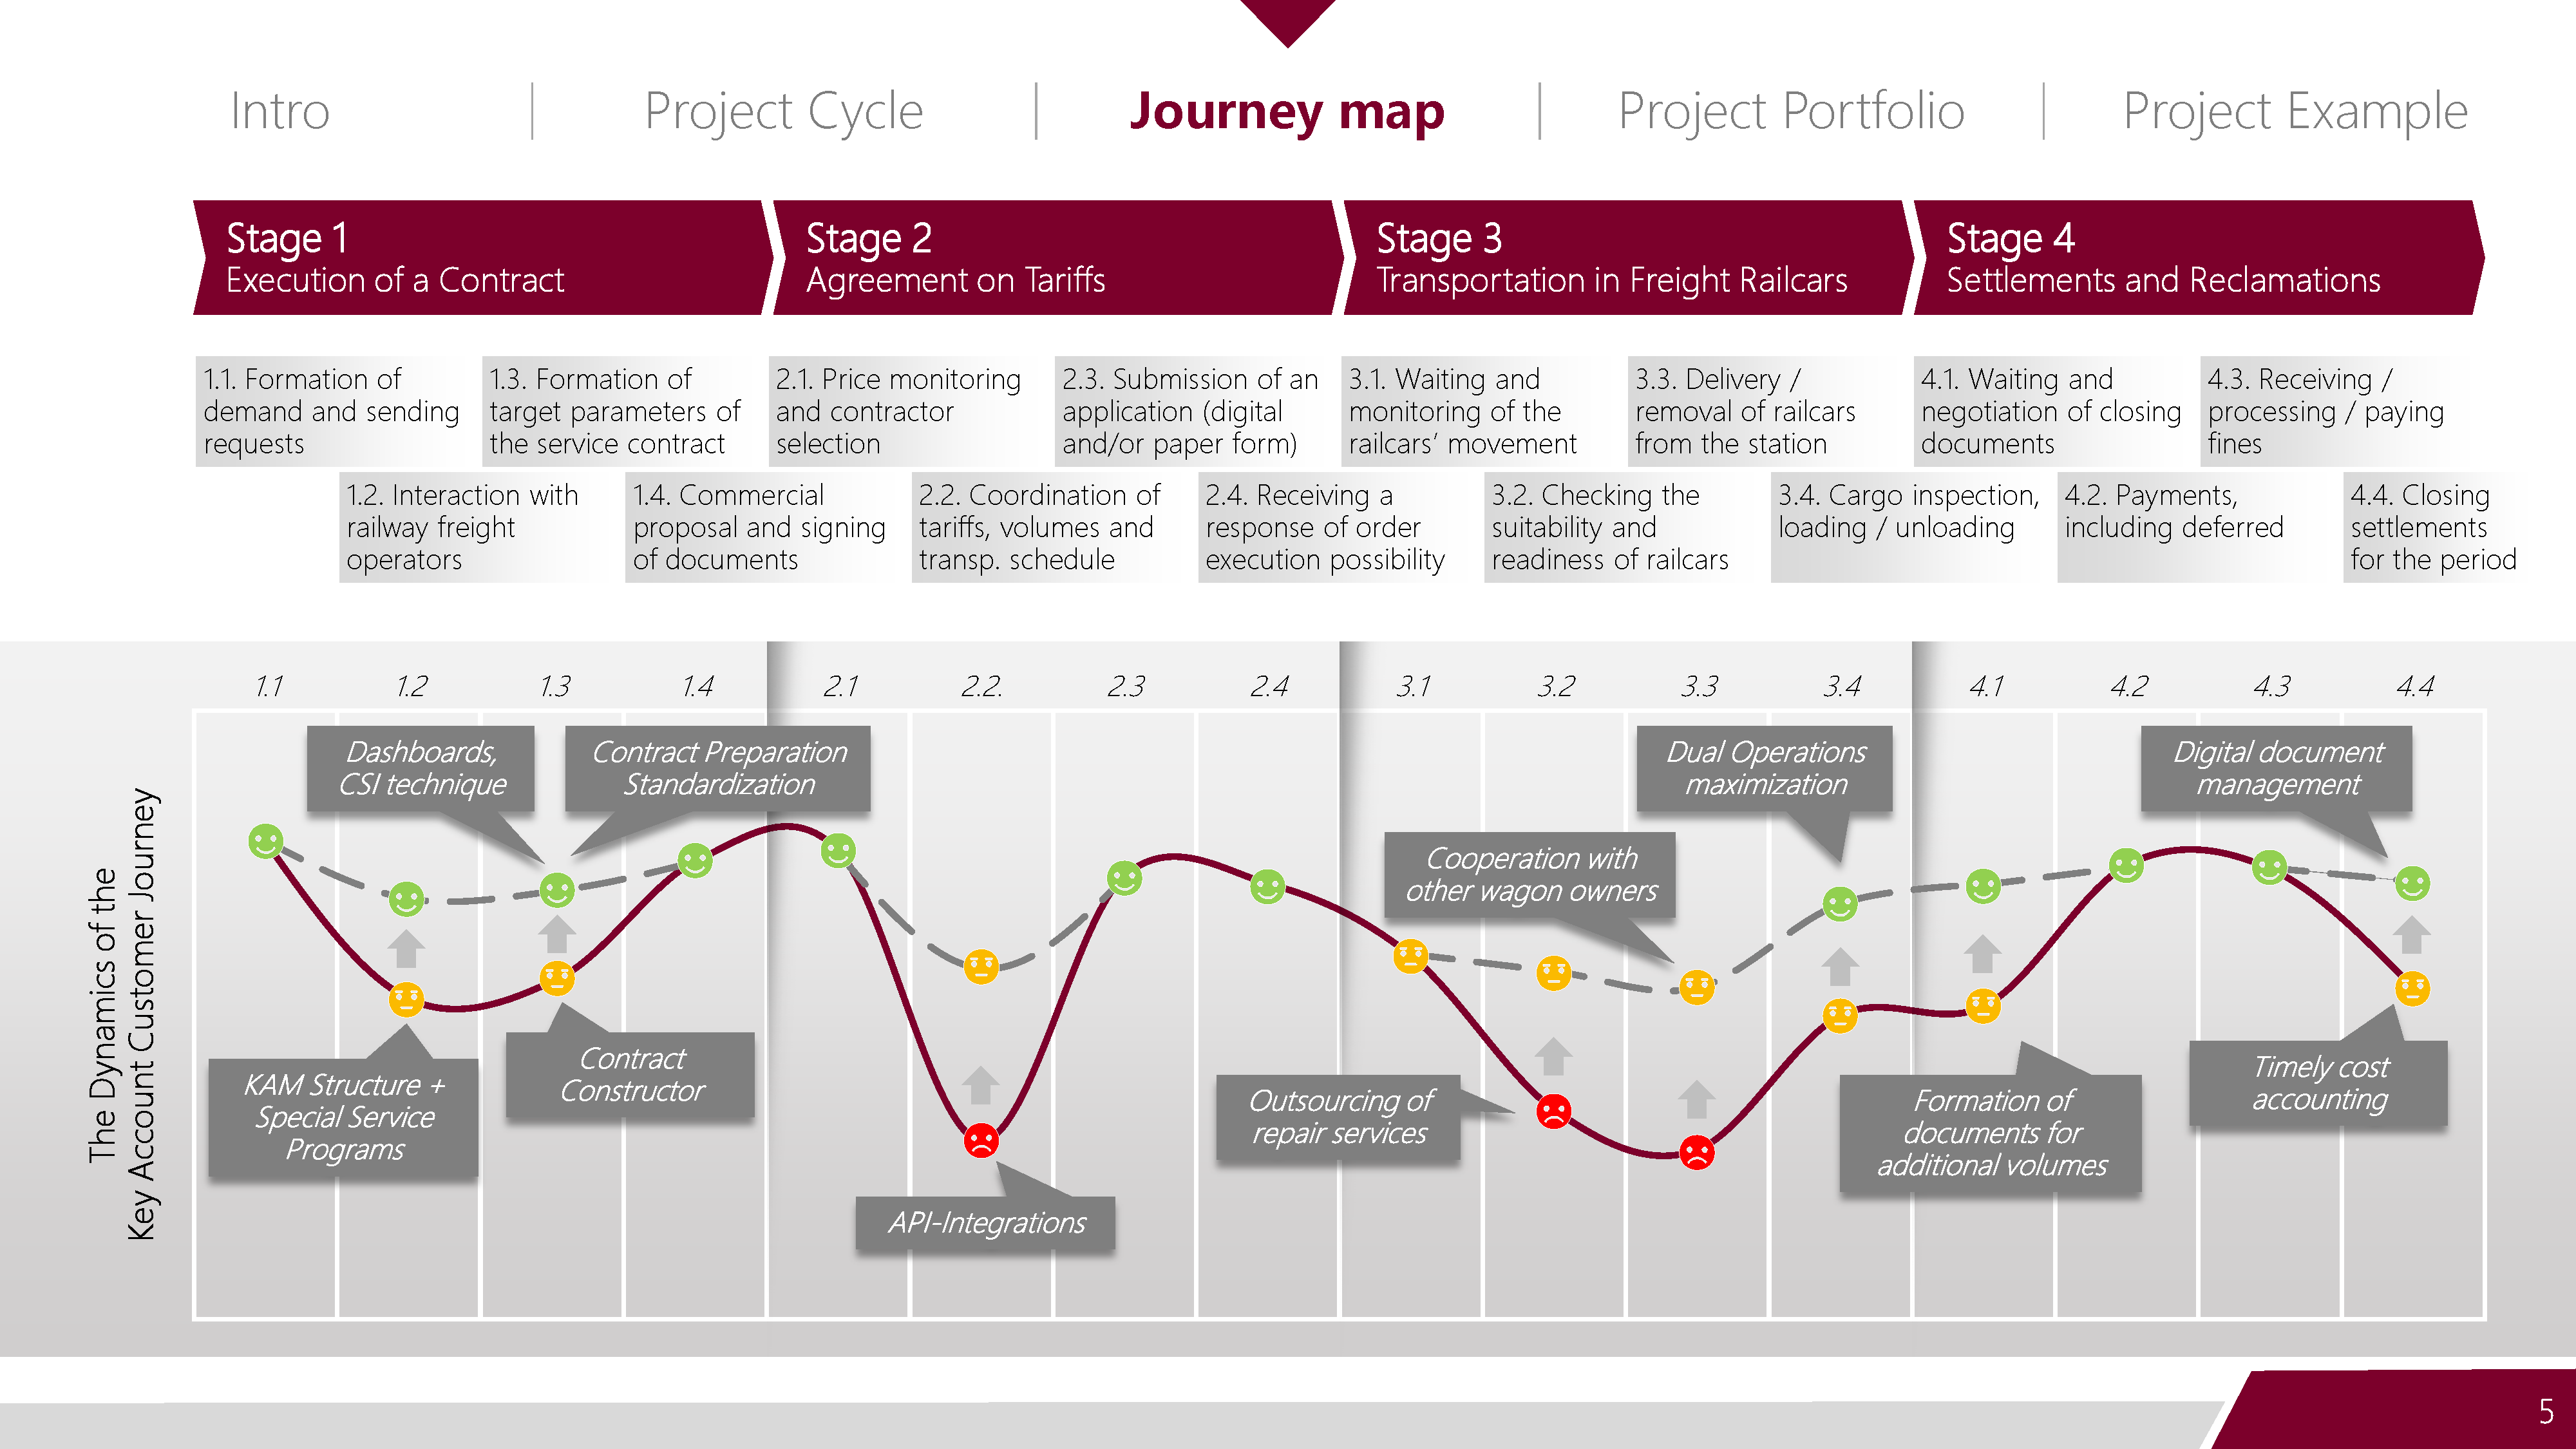
A core part of the project was the construction of a customer journey map for key accounts in freight rail transportation.
The journey was decomposed into four major stages:
- contract execution
- tariff agreement
- transportation in freight railcars
- settlements and reclamations
Within these stages, the team mapped detailed interactions such as request submission, contractor selection, coordination of tariffs and schedules, order confirmation, railcar movement monitoring, delivery and removal of railcars, loading and unloading, document processing, payments, fines, and closing settlements.
This structure made it possible to identify where customer pain points were concentrated and where the company could intervene most effectively. It also created a shared language for linking customer experience issues with concrete operational initiatives.
🧩 Portfolio Design Logic
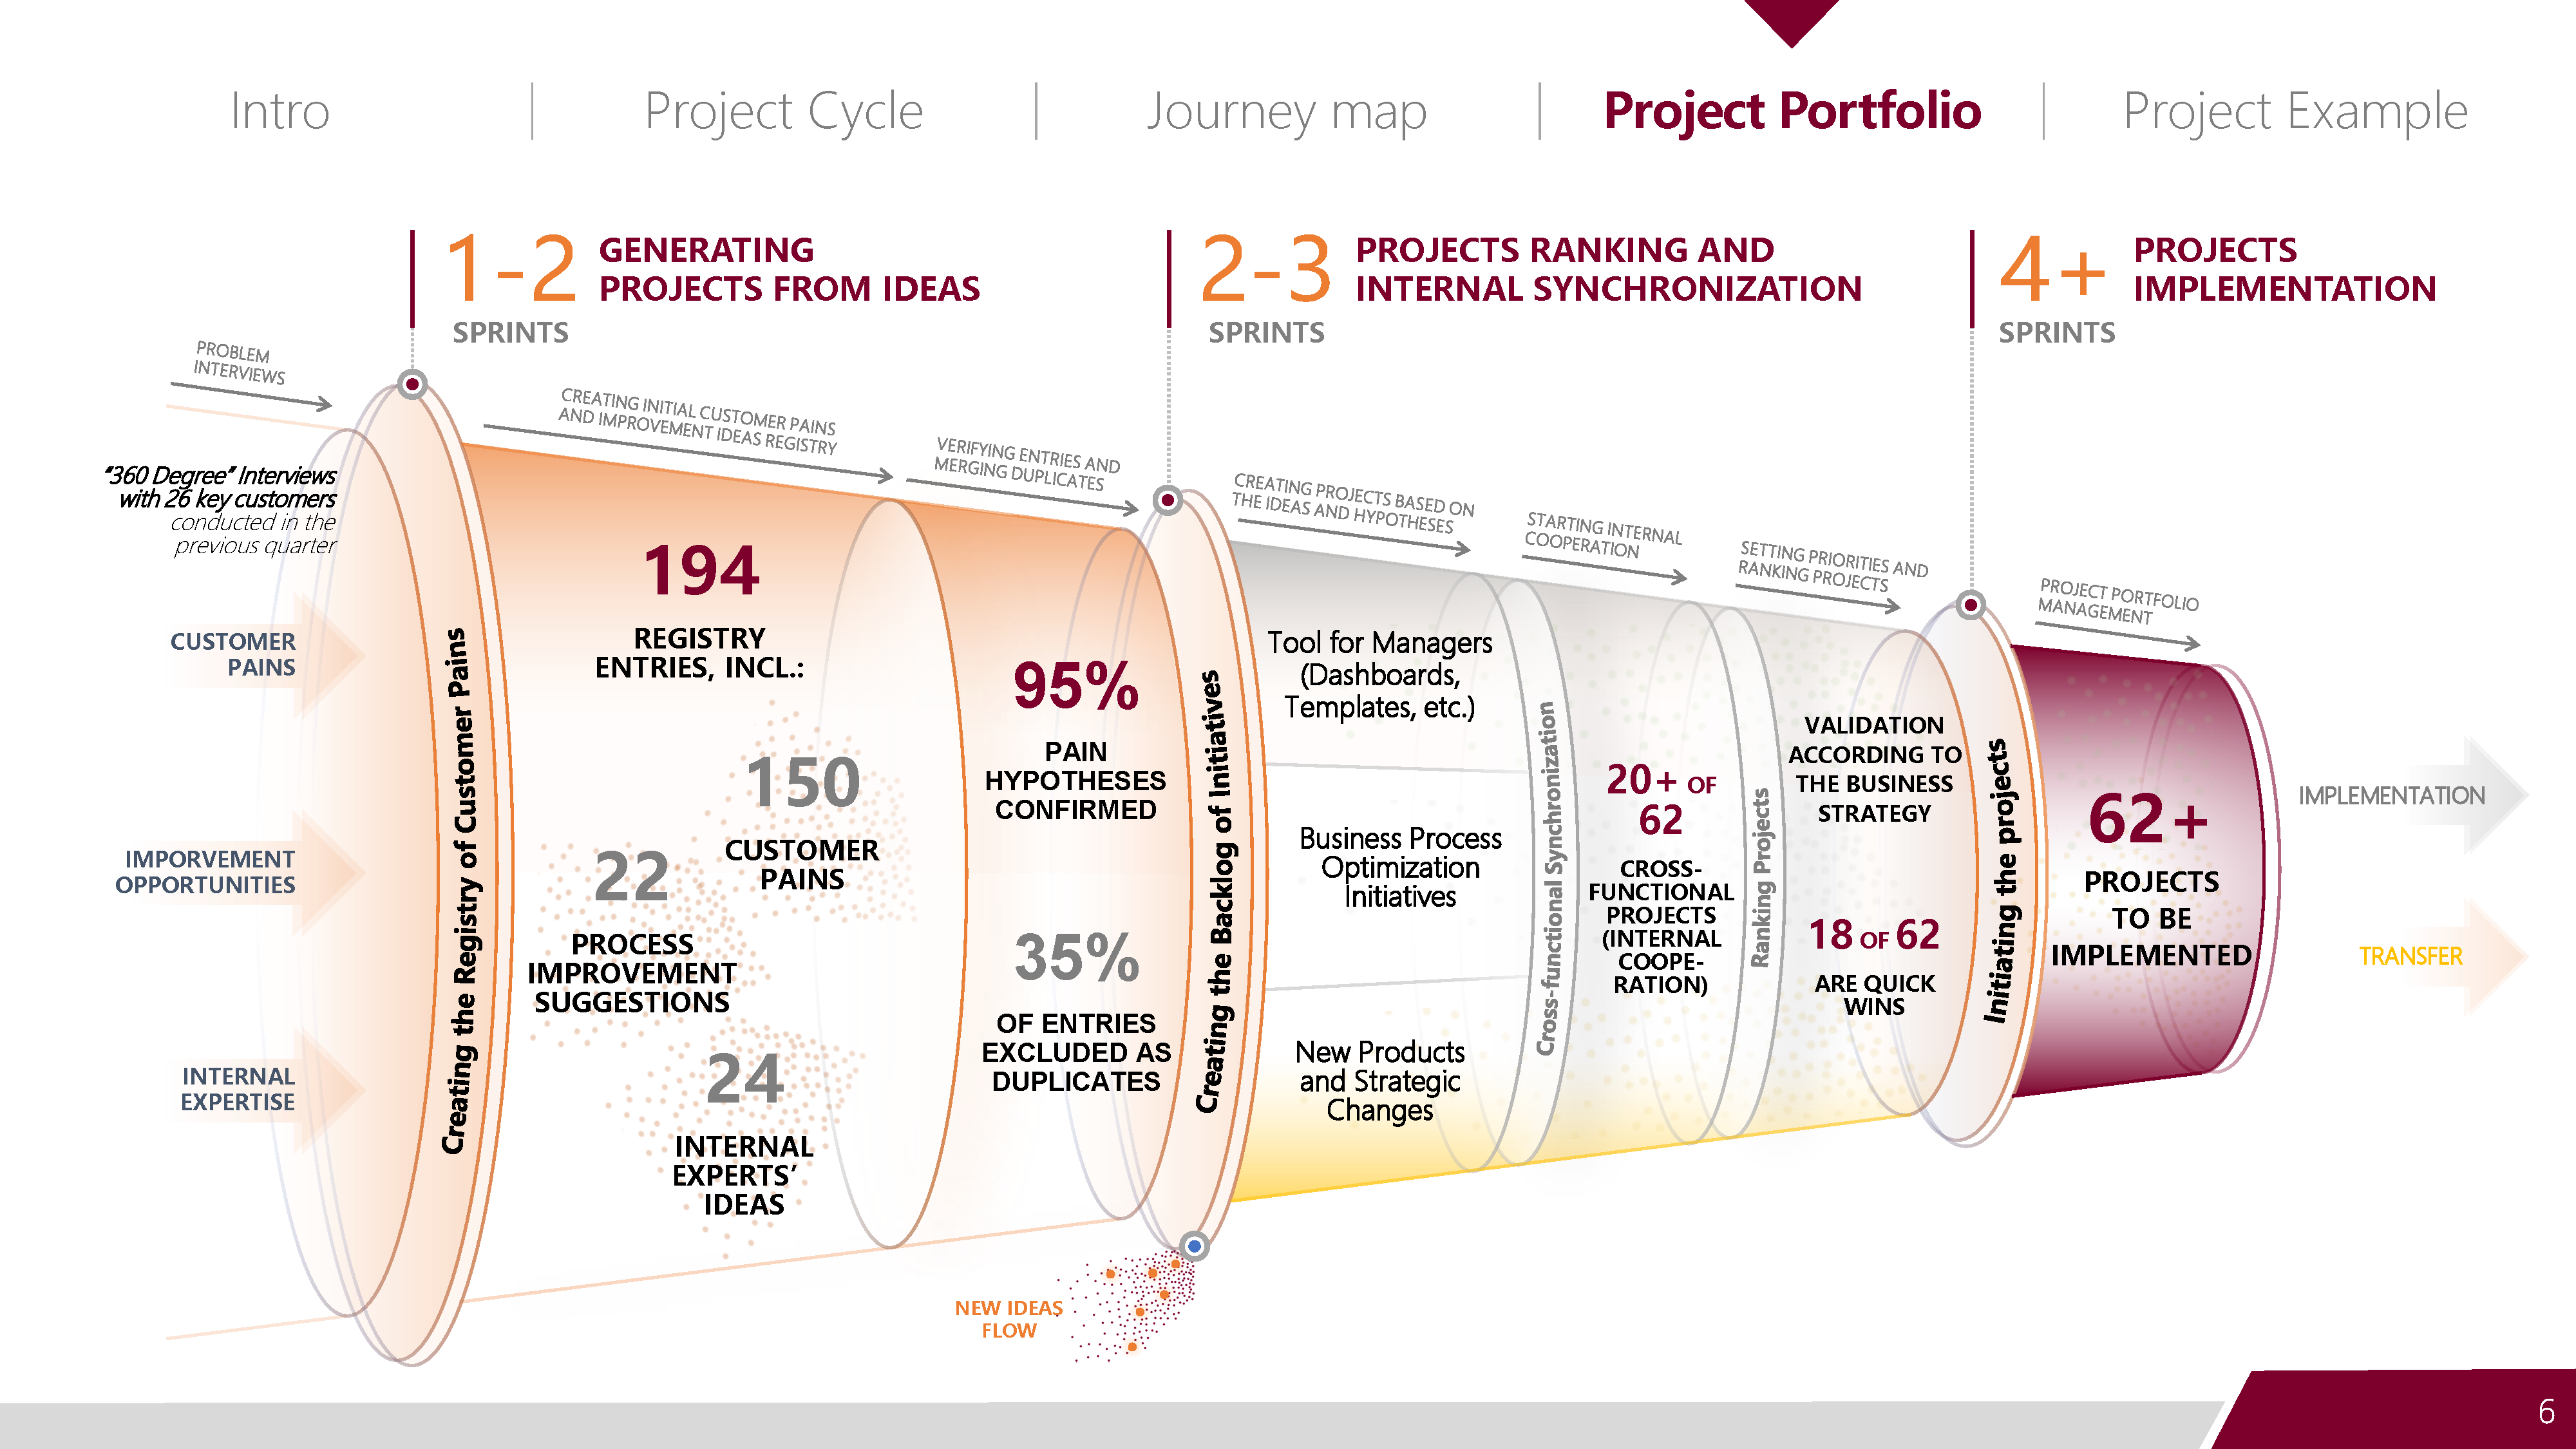
The project portfolio was created by combining three main sources of input:
- customer pains
- improvement opportunities
- internal expertise
The process began with 360-degree interviews with 26 key customers. Those interviews, together with internal analysis, produced a registry of 194 entries, including 150 customer pains, 22 process improvement suggestions, and 24 ideas from internal experts.
After validation and duplicate removal, 95% of pain hypotheses were confirmed, while 35% of entries were excluded as duplicates. The resulting backlog was then translated into business process optimization initiatives, new products, and strategic changes. Cross-functional synchronization played a major role, with more than 20 of 62 projects requiring internal cooperation across functions. Eighteen of the 62 identified projects were classified as quick wins.
📊 Example Deliverable
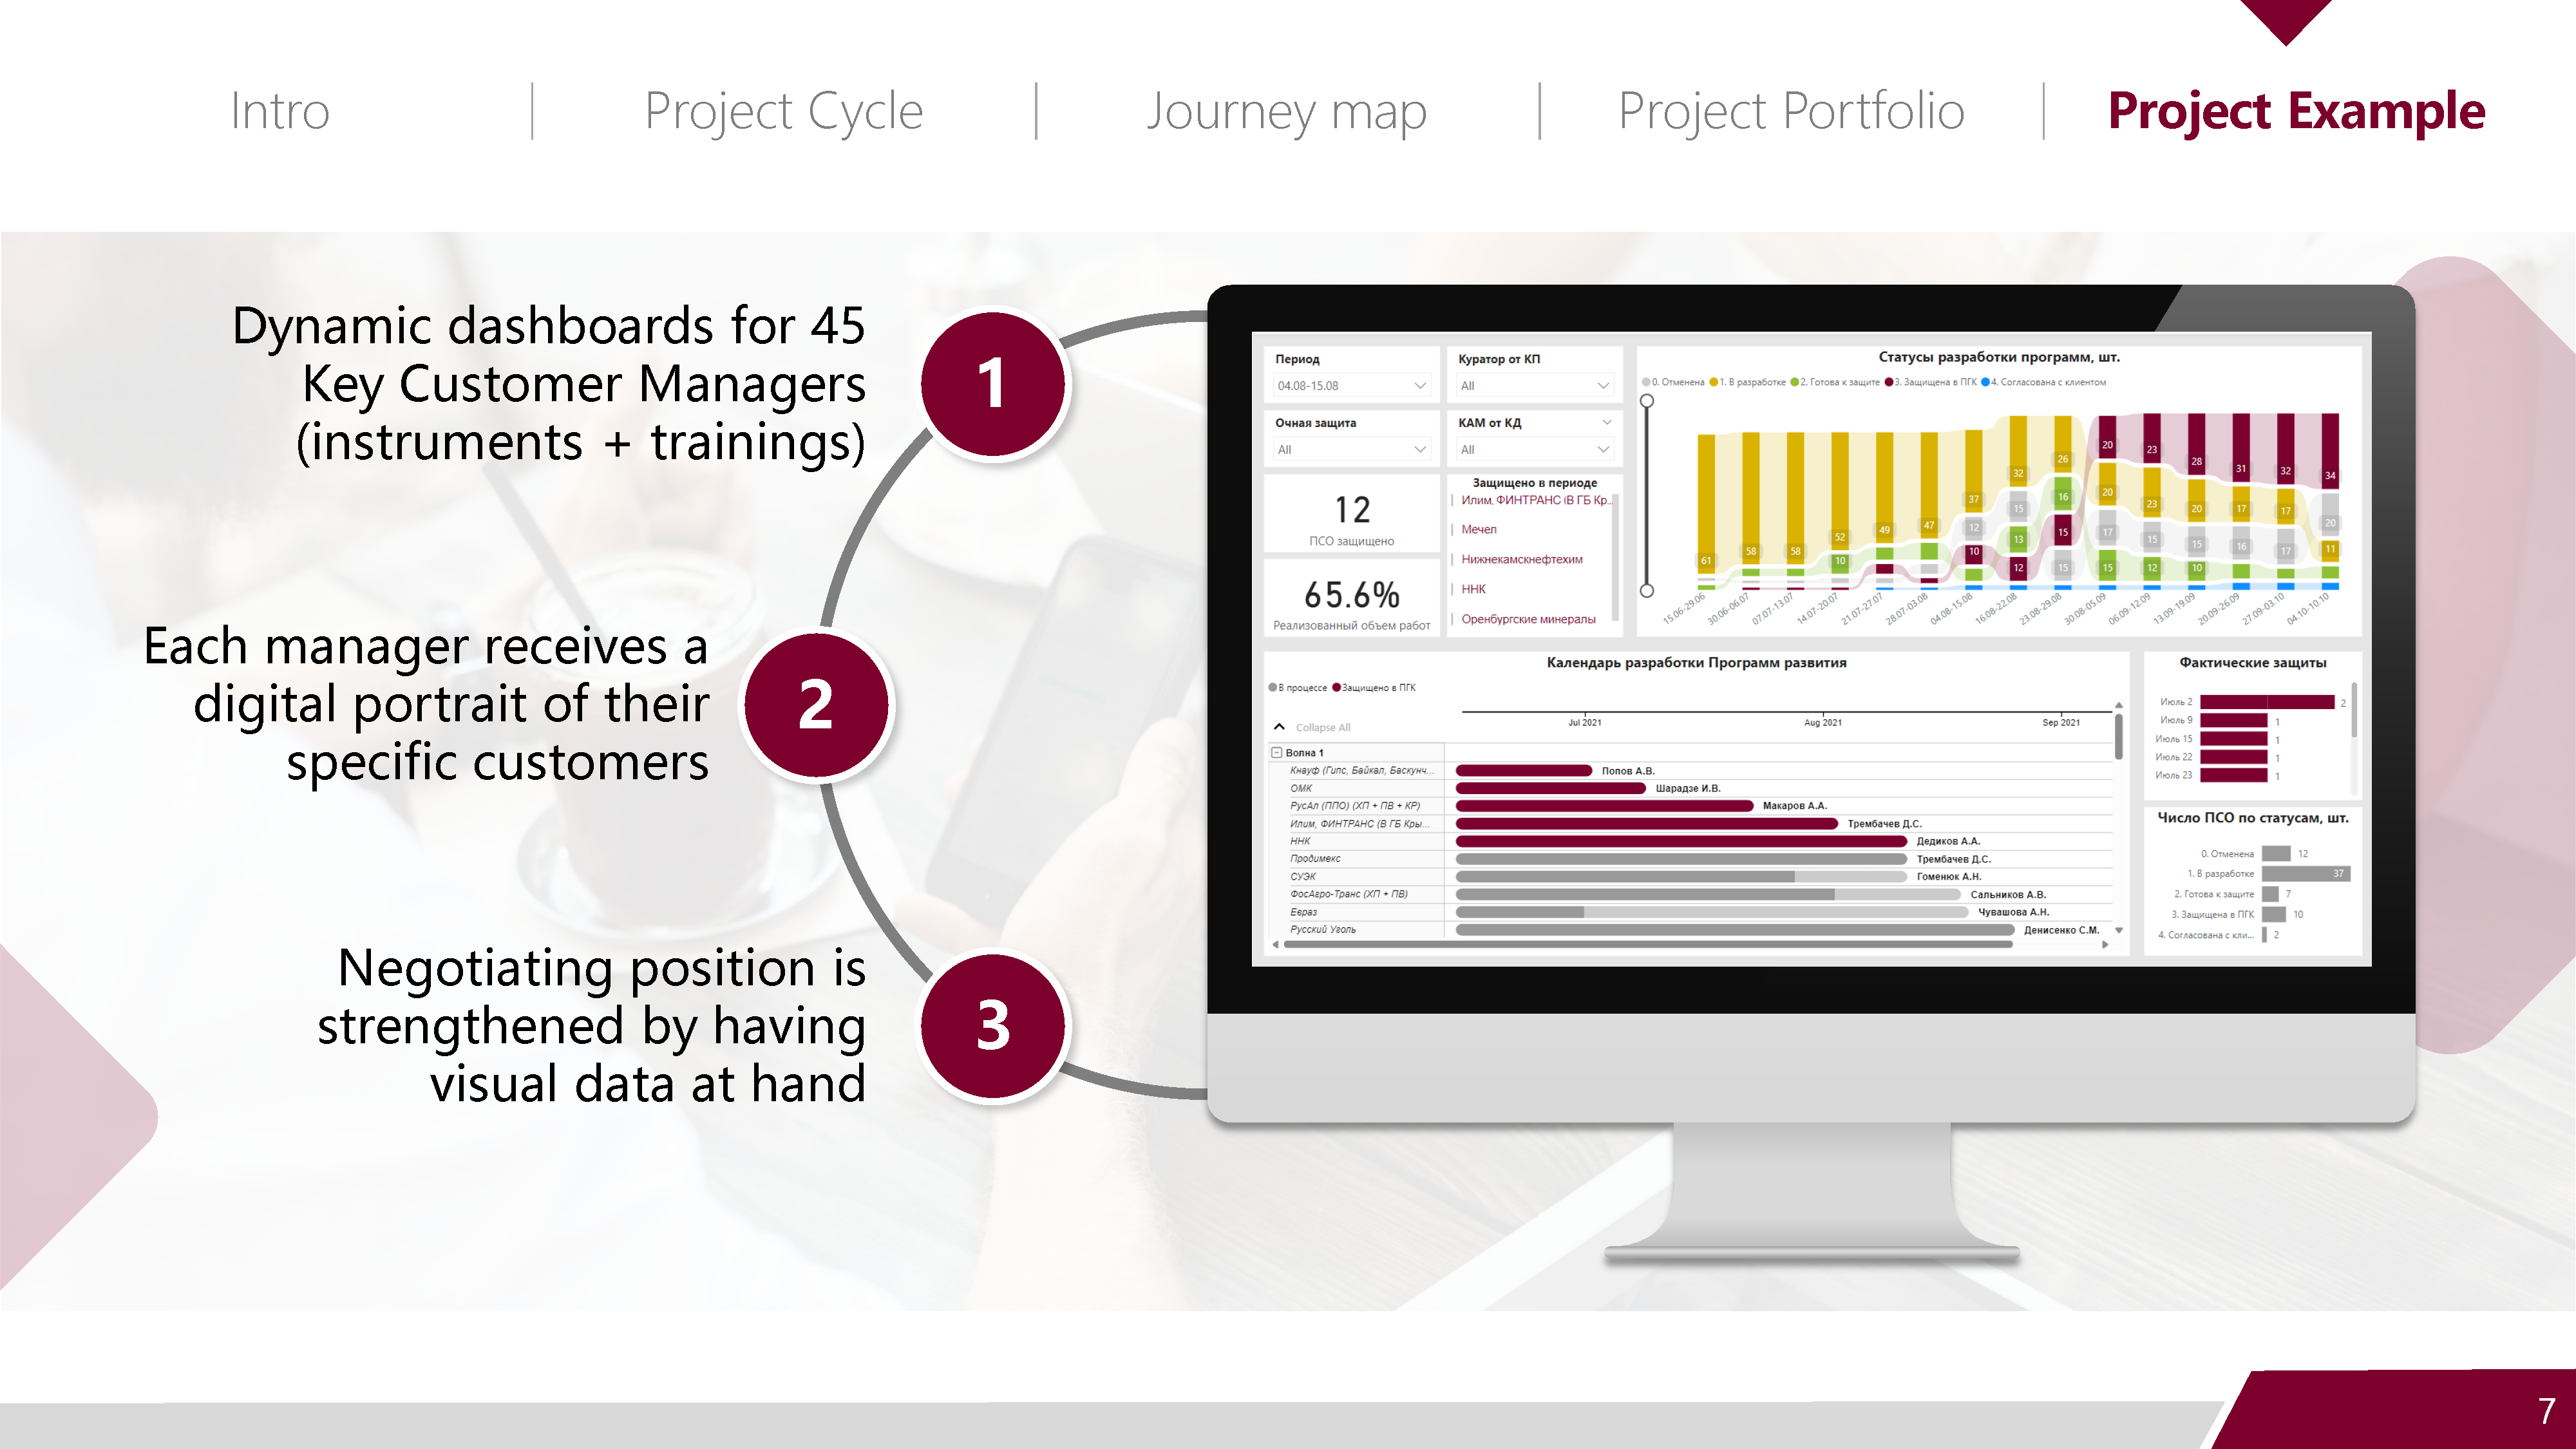
One of the practical outputs of the initiative was a set of dynamic dashboards for 45 key account managers.
These dashboards gave each manager a digital portrait of their customers and strengthened negotiating positions by making customer-specific operational and commercial information more visible and easier to use in day-to-day work. This example illustrates that the project was not limited to strategy design, but also translated into concrete analytical tools for business users.
✅ Outcome
The project established a structured bridge between customer research and project portfolio formation. Instead of treating customer feedback as isolated observations, the company gained a repeatable mechanism for converting qualitative pain points into a validated and prioritized portfolio of initiatives.
The framework was later used to quantify the impact of initiatives with indirect economic effects, such as assigning dedicated account managers to key clients and implementing a CRM system, by estimating their contribution to customer loyalty through the conclusion and renewal of long-term contracts. In 2022, the team evaluated initiatives delivered in 2021, and their contribution exceeded RUB 300 million (approximately $4 million) in 2022.
This assessment made it possible to capture the team’s real impact on customer relationships alongside initiatives with more direct economic effects, such as launching new freight corridors. As a result, the organization was better positioned to coordinate improvement efforts across functions, identify quick wins, support strategic changes, and align implementation with both customer loyalty and business performance objectives.
🔍 Why This Project Matters
This case demonstrates an ability to work at the intersection of customer experience, operations, analytics, and strategic project management.
It shows how customer journey mapping can be used not only as a research artifact, but as a practical engine for portfolio design, prioritization, and execution. It also highlights experience with turning complex qualitative input into structured managerial tools, analytical dashboards, and implementation-ready initiatives.