Startup Financial Model and Scenario Analysis
This project presents a reusable Excel-based financial model for startup valuation, scenario planning, and investment analysis.
Download .xlsx file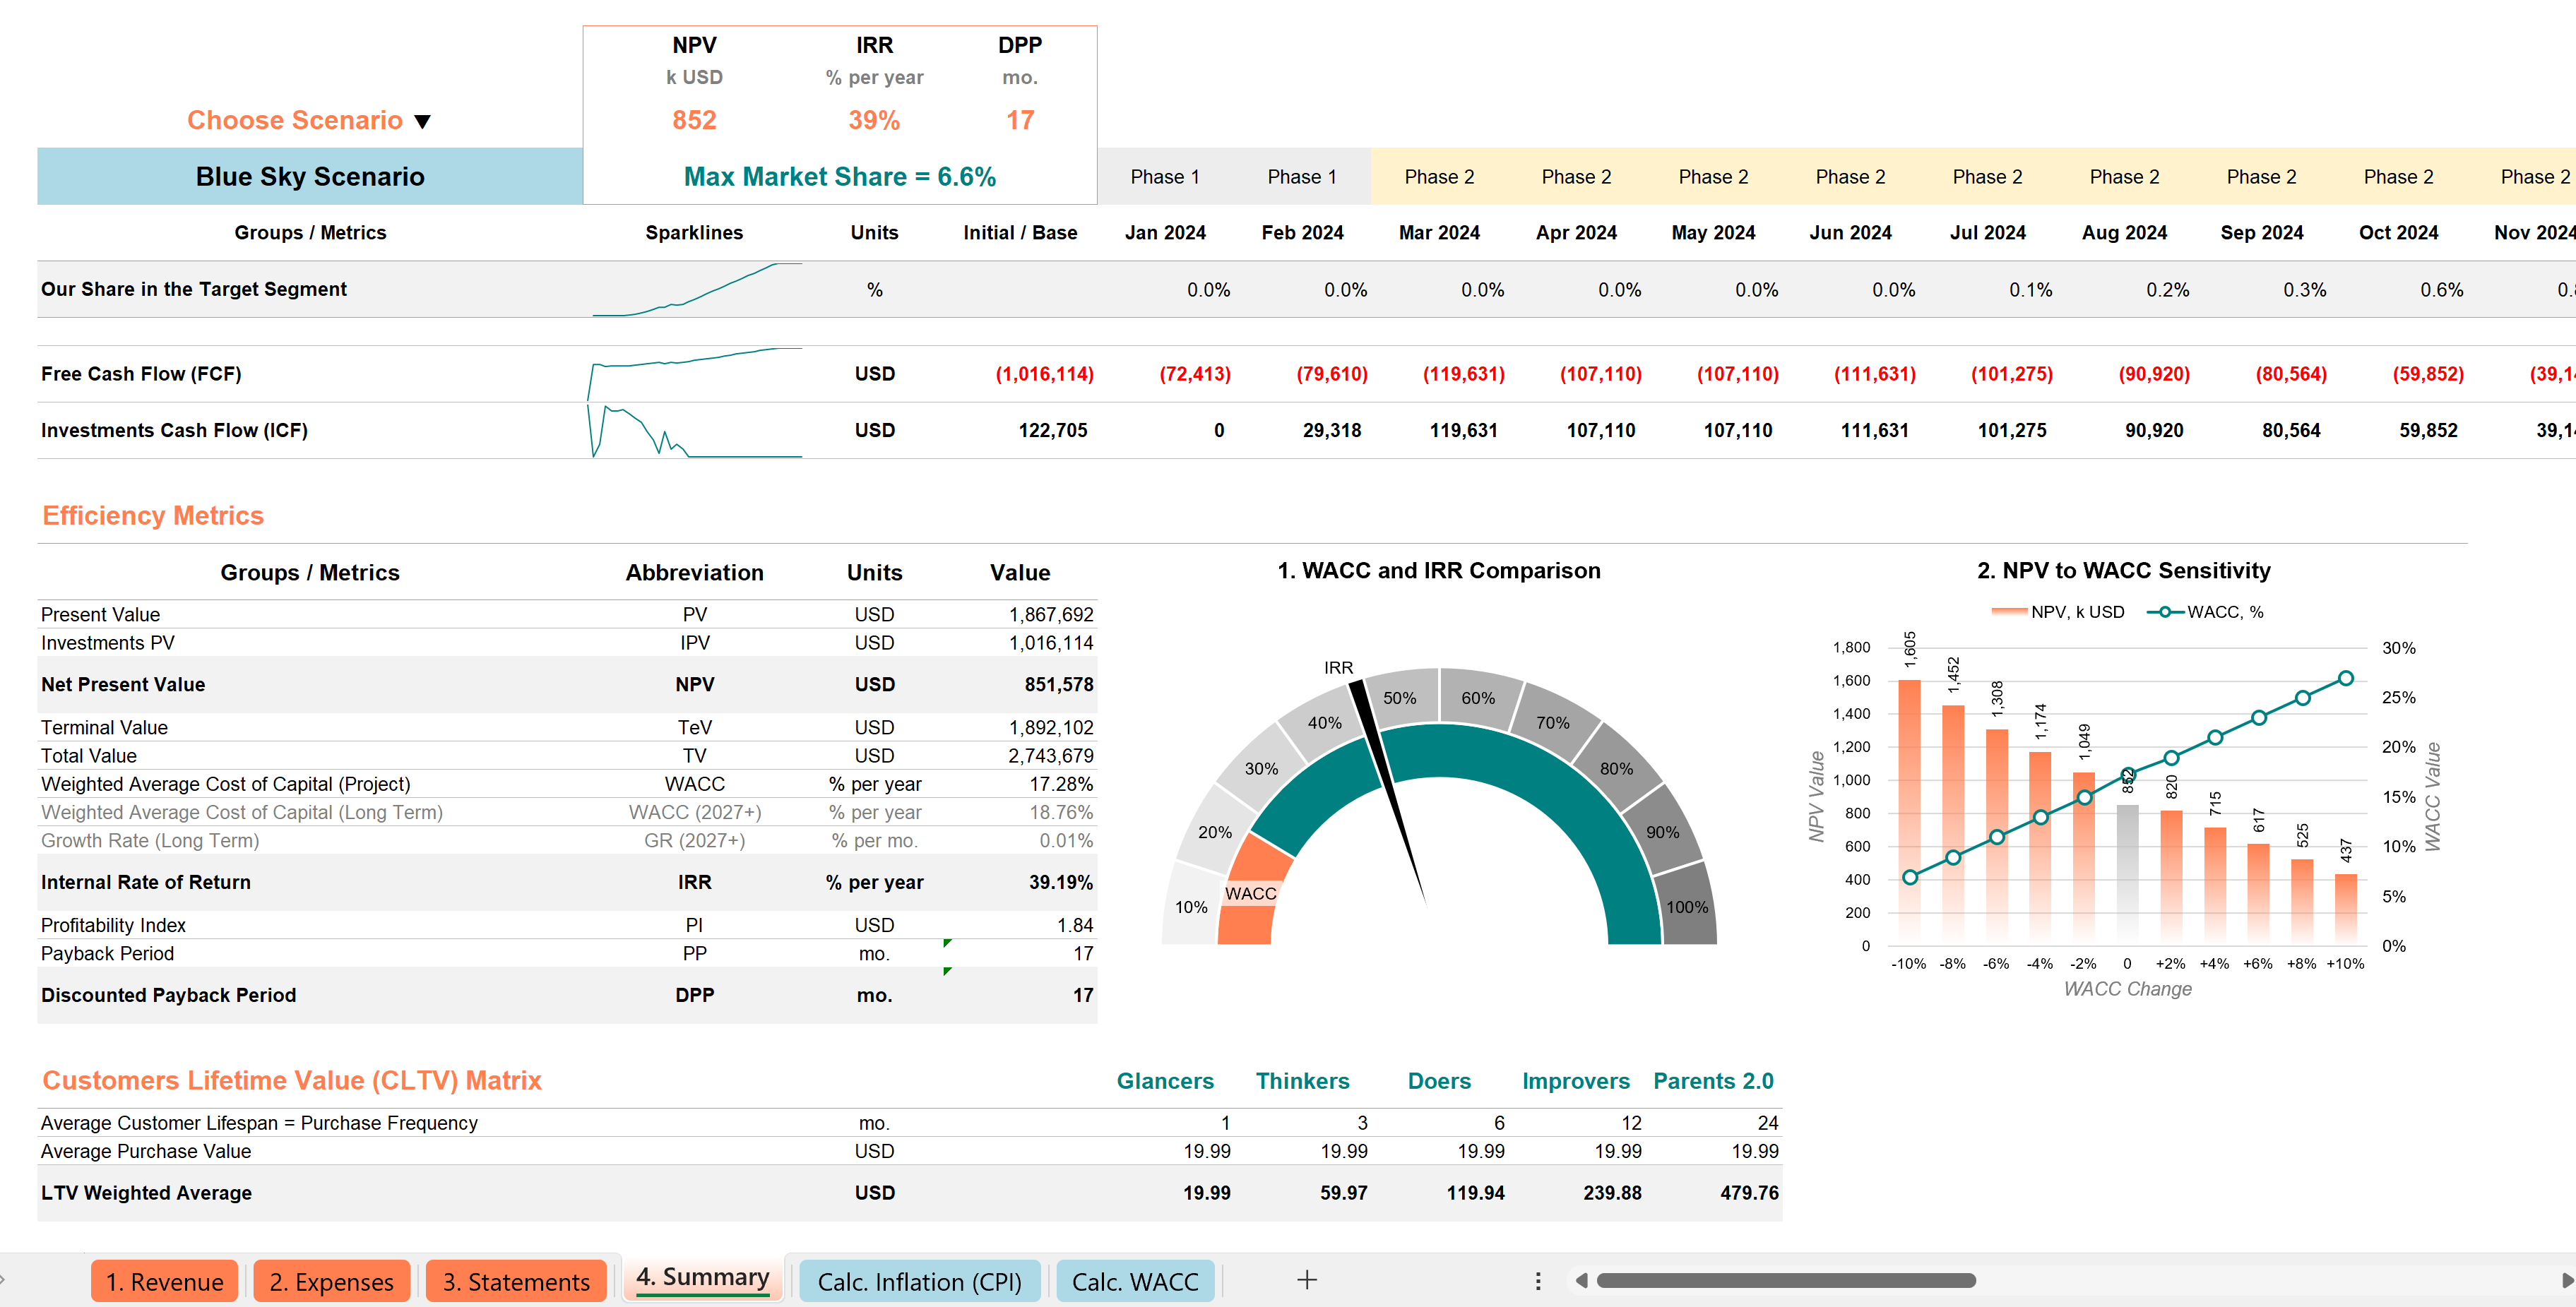
📌 Overview
This project is a comprehensive Excel financial model built for a startup developing a mobile application for parents. It combines revenue forecasting, expense planning, integrated financial statements, investment efficiency analysis, and dynamic scenario modeling in a single workbook.
The model covers a three-year forecast horizon plus a post-forecast period and was designed not only for this specific startup, but also as a reusable template for evaluating other investment opportunities.
👤 My Role
I built the model from scratch, including data collection, business assumption structuring, revenue and cost forecasting, cash flow development, financial statement construction, dashboard design, result interpretation, and preparation of strategic recommendations for the startup team.
🎯 Project Goal
The main goal was to help the startup assess its commercial potential in a structured and decision-oriented way. The model needed to connect business assumptions with financial outcomes and show how the project performed under different scenarios.
More specifically, it was designed to answer several practical questions:
- how much revenue the startup could generate under different market assumptions
- how operating costs would evolve as the business scaled
- what the projected P&L, Cash Flow, and Balance Sheet would look like
- whether the project created value based on NPV, IRR, and DPP
- how sensitive valuation was to changes in WACC
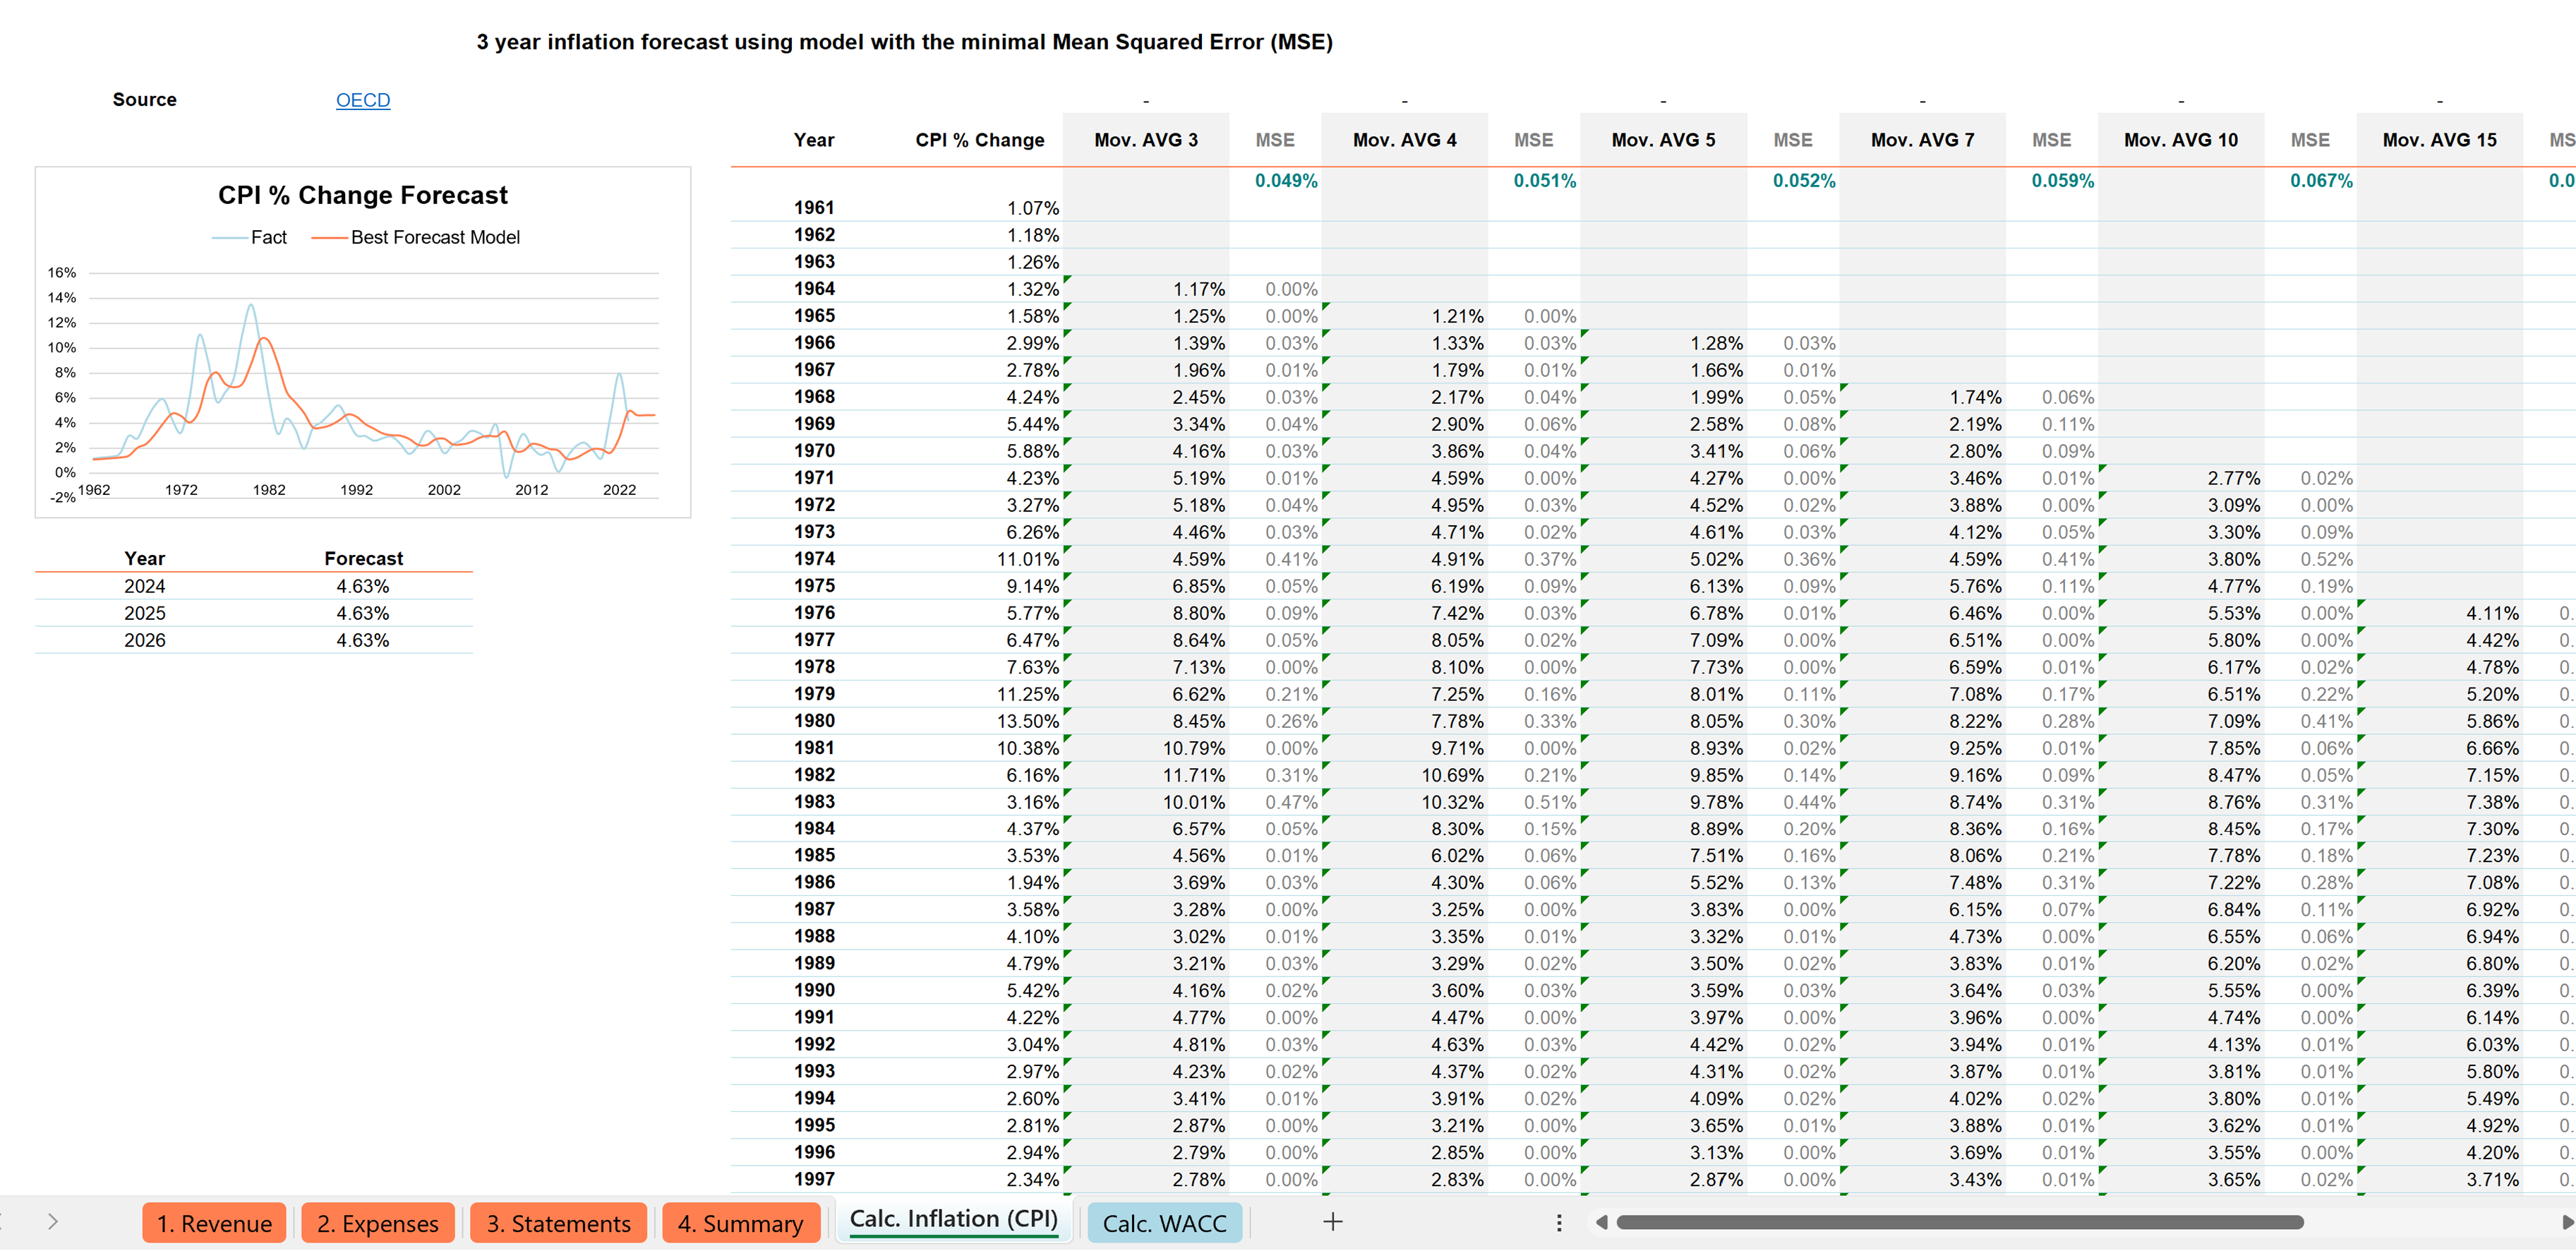
- which forecasting method was most appropriate for macroeconomic assumptions used in discount-rate estimation
🛠️ Tool Stack
Microsoft Excel, financial modeling, DCF valuation, three-statement modeling, scenario analysis, CAPM-based WACC calculation, regression analysis, moving average, exponential smoothing, sensitivity analysis, sparklines, color coding, and formula-driven dashboard design without macros.
🧱 Model Structure
The workbook is organized into several interconnected sheets that move from assumptions to valuation and decision support.
Revenue
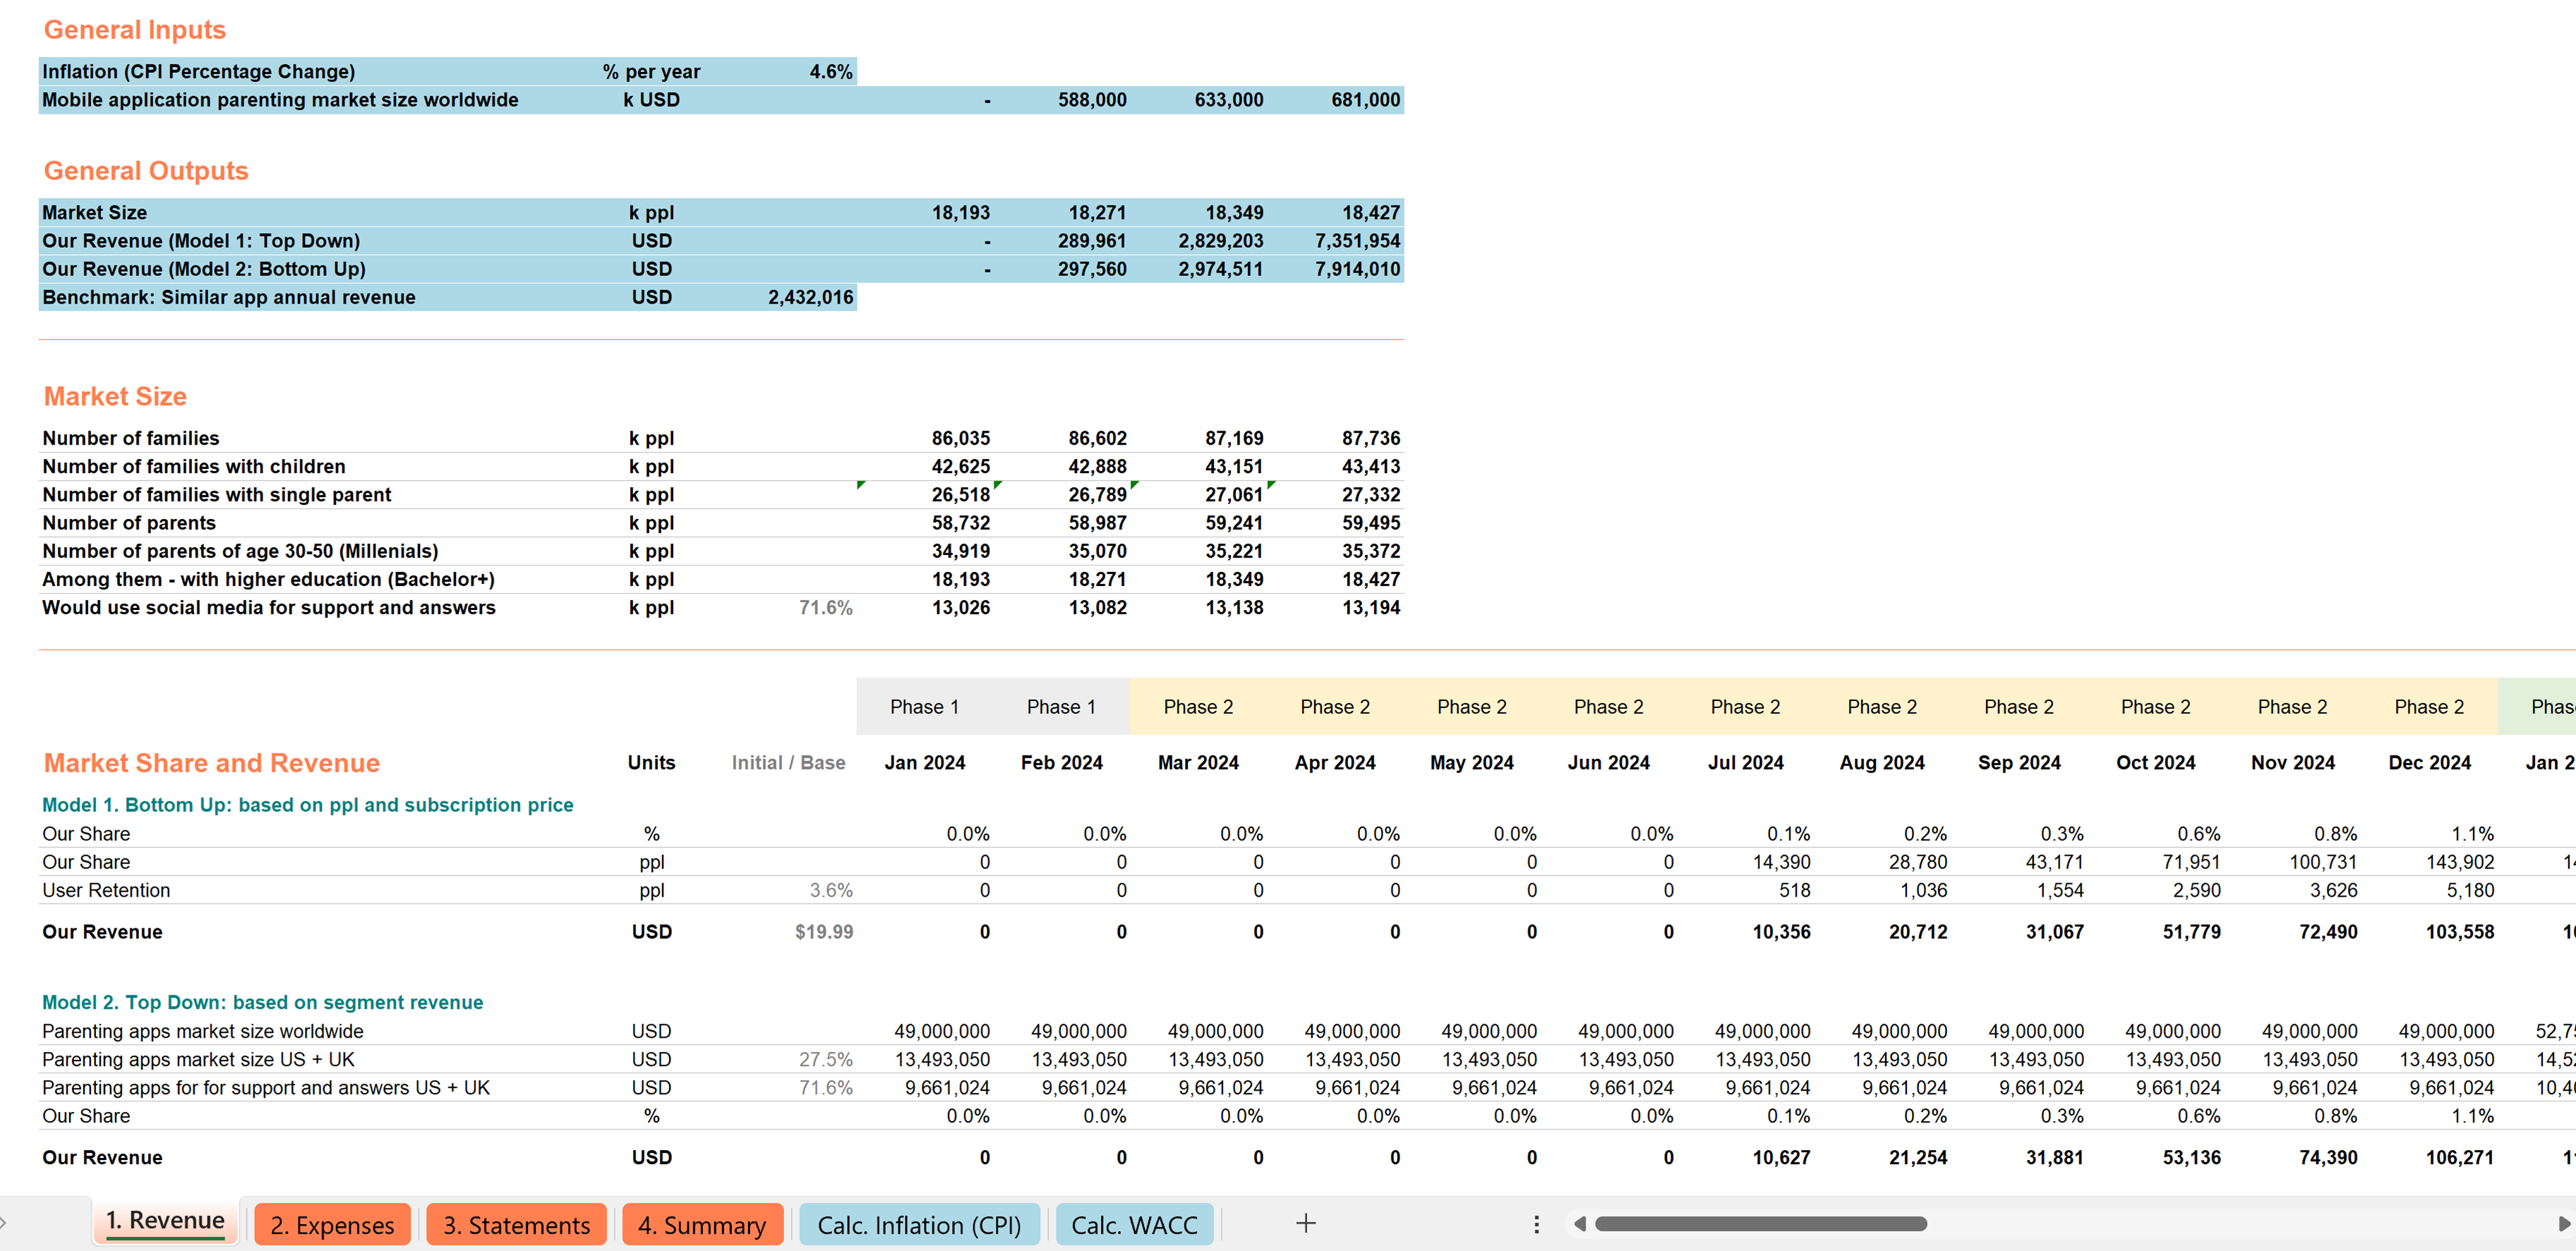
This sheet contains the commercial forecast and uses two alternative revenue estimation approaches:
- Model 1: Bottom-Up, based on user volume and subscription price
- Model 2: Top-Down, based on segment revenue potential
This structure strengthens the model by combining an operational view with a market-based view.
Expenses
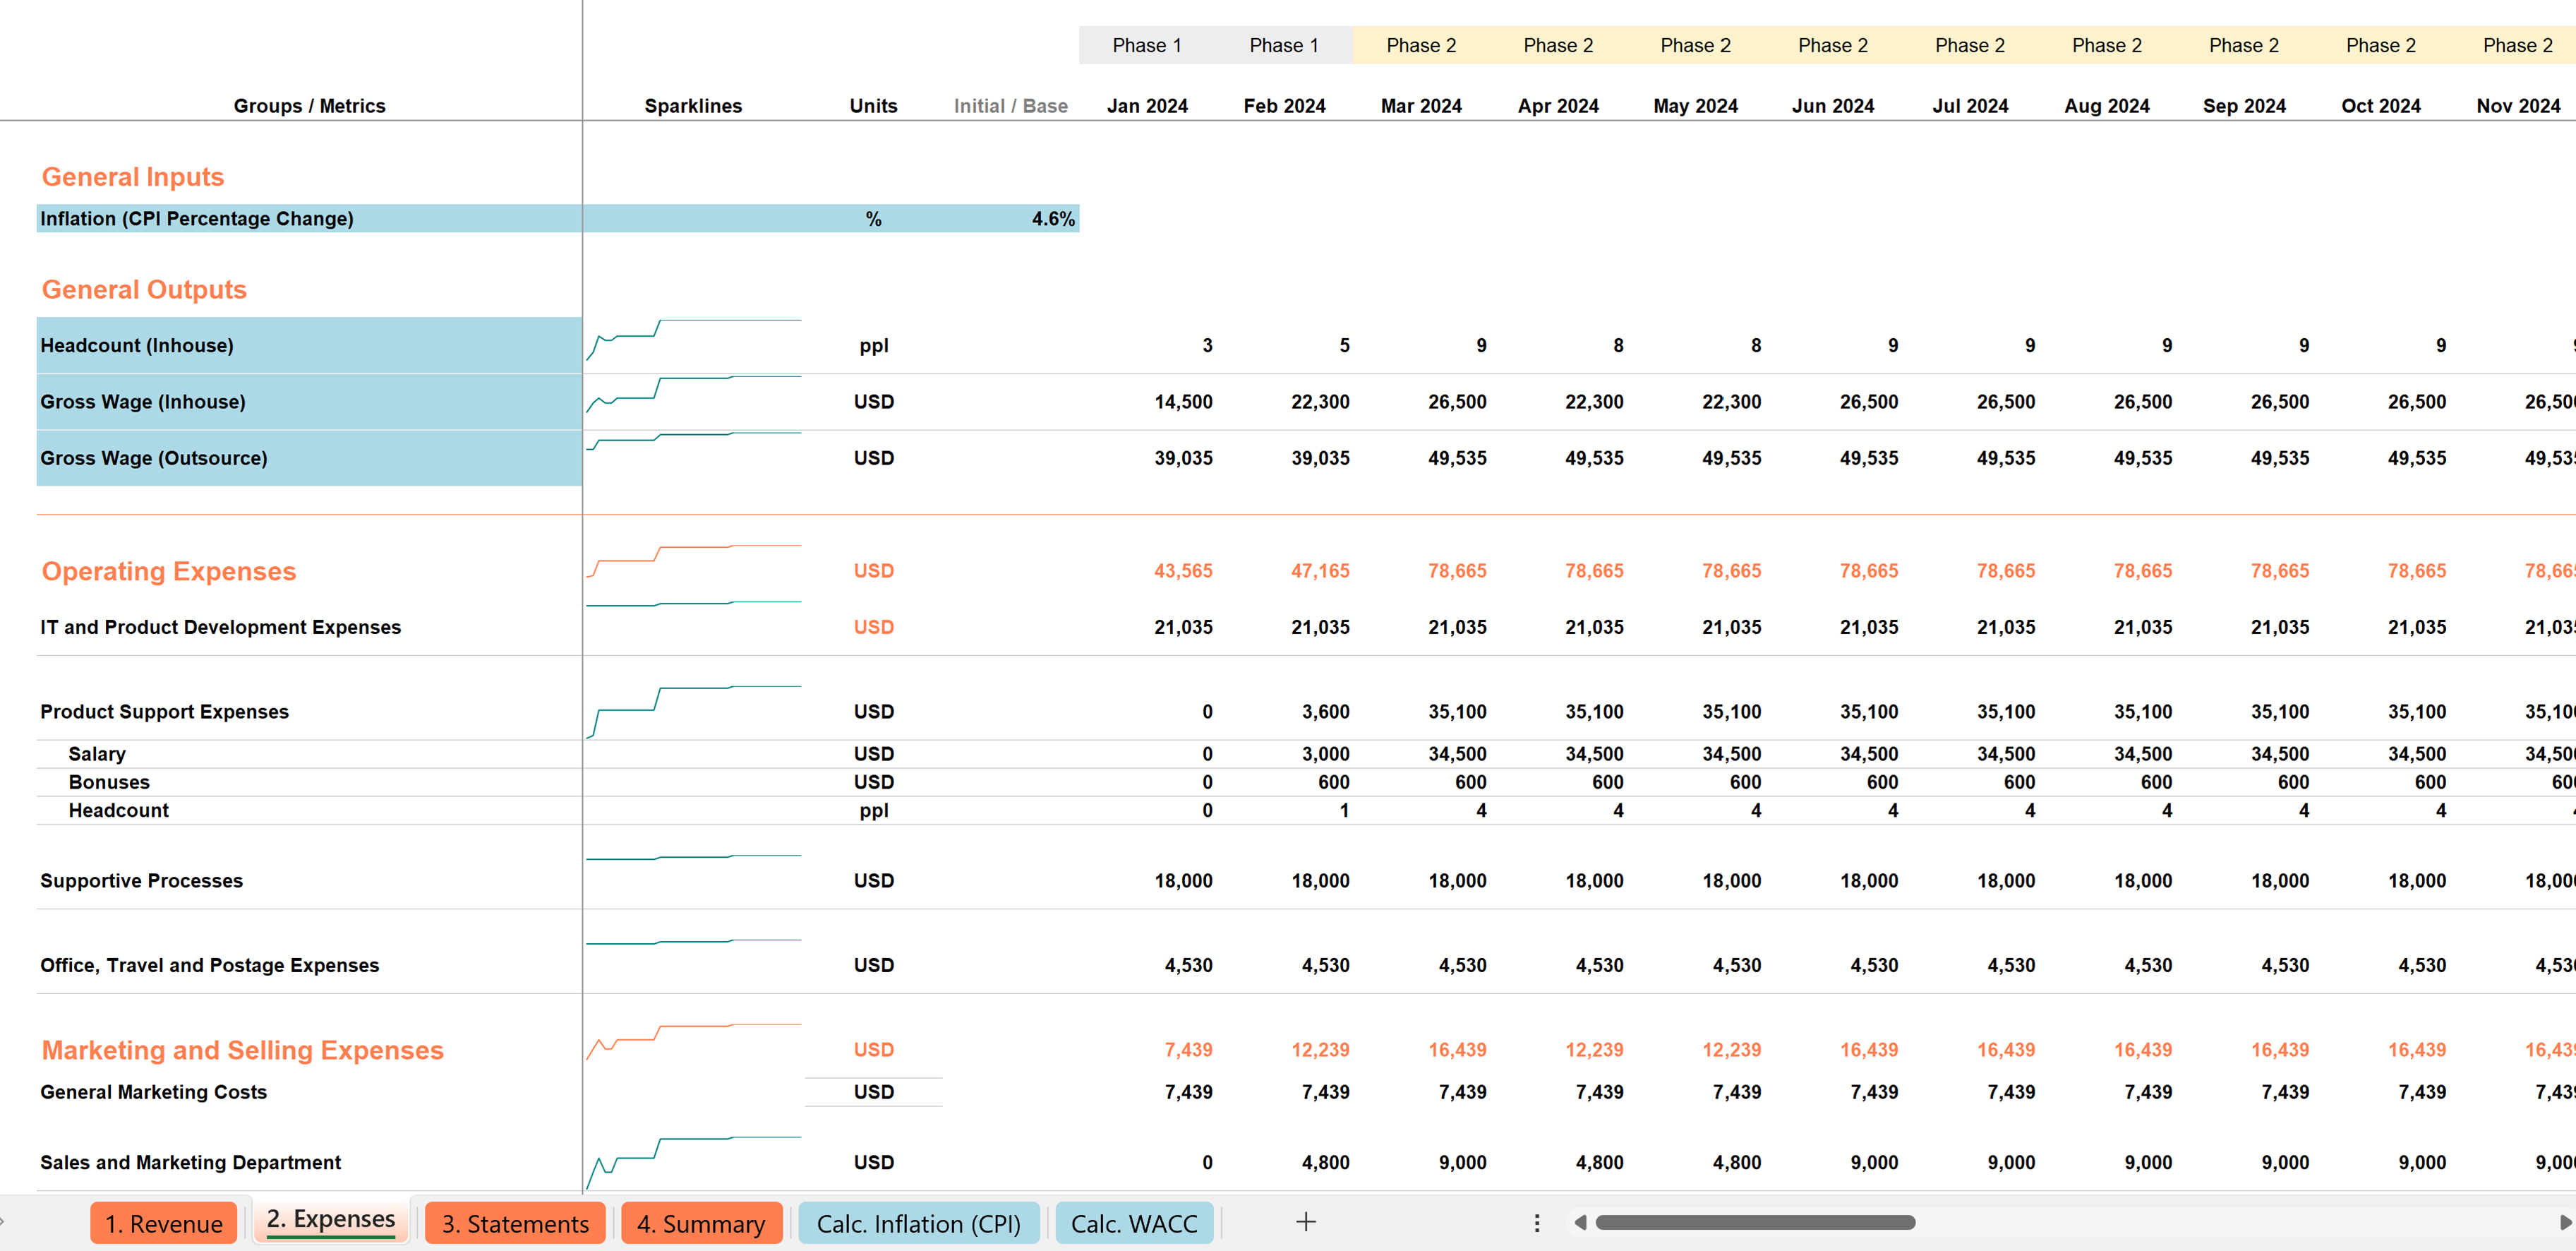
This sheet contains a detailed forecast of fixed and variable costs tailored to the startup’s business model.
Statements
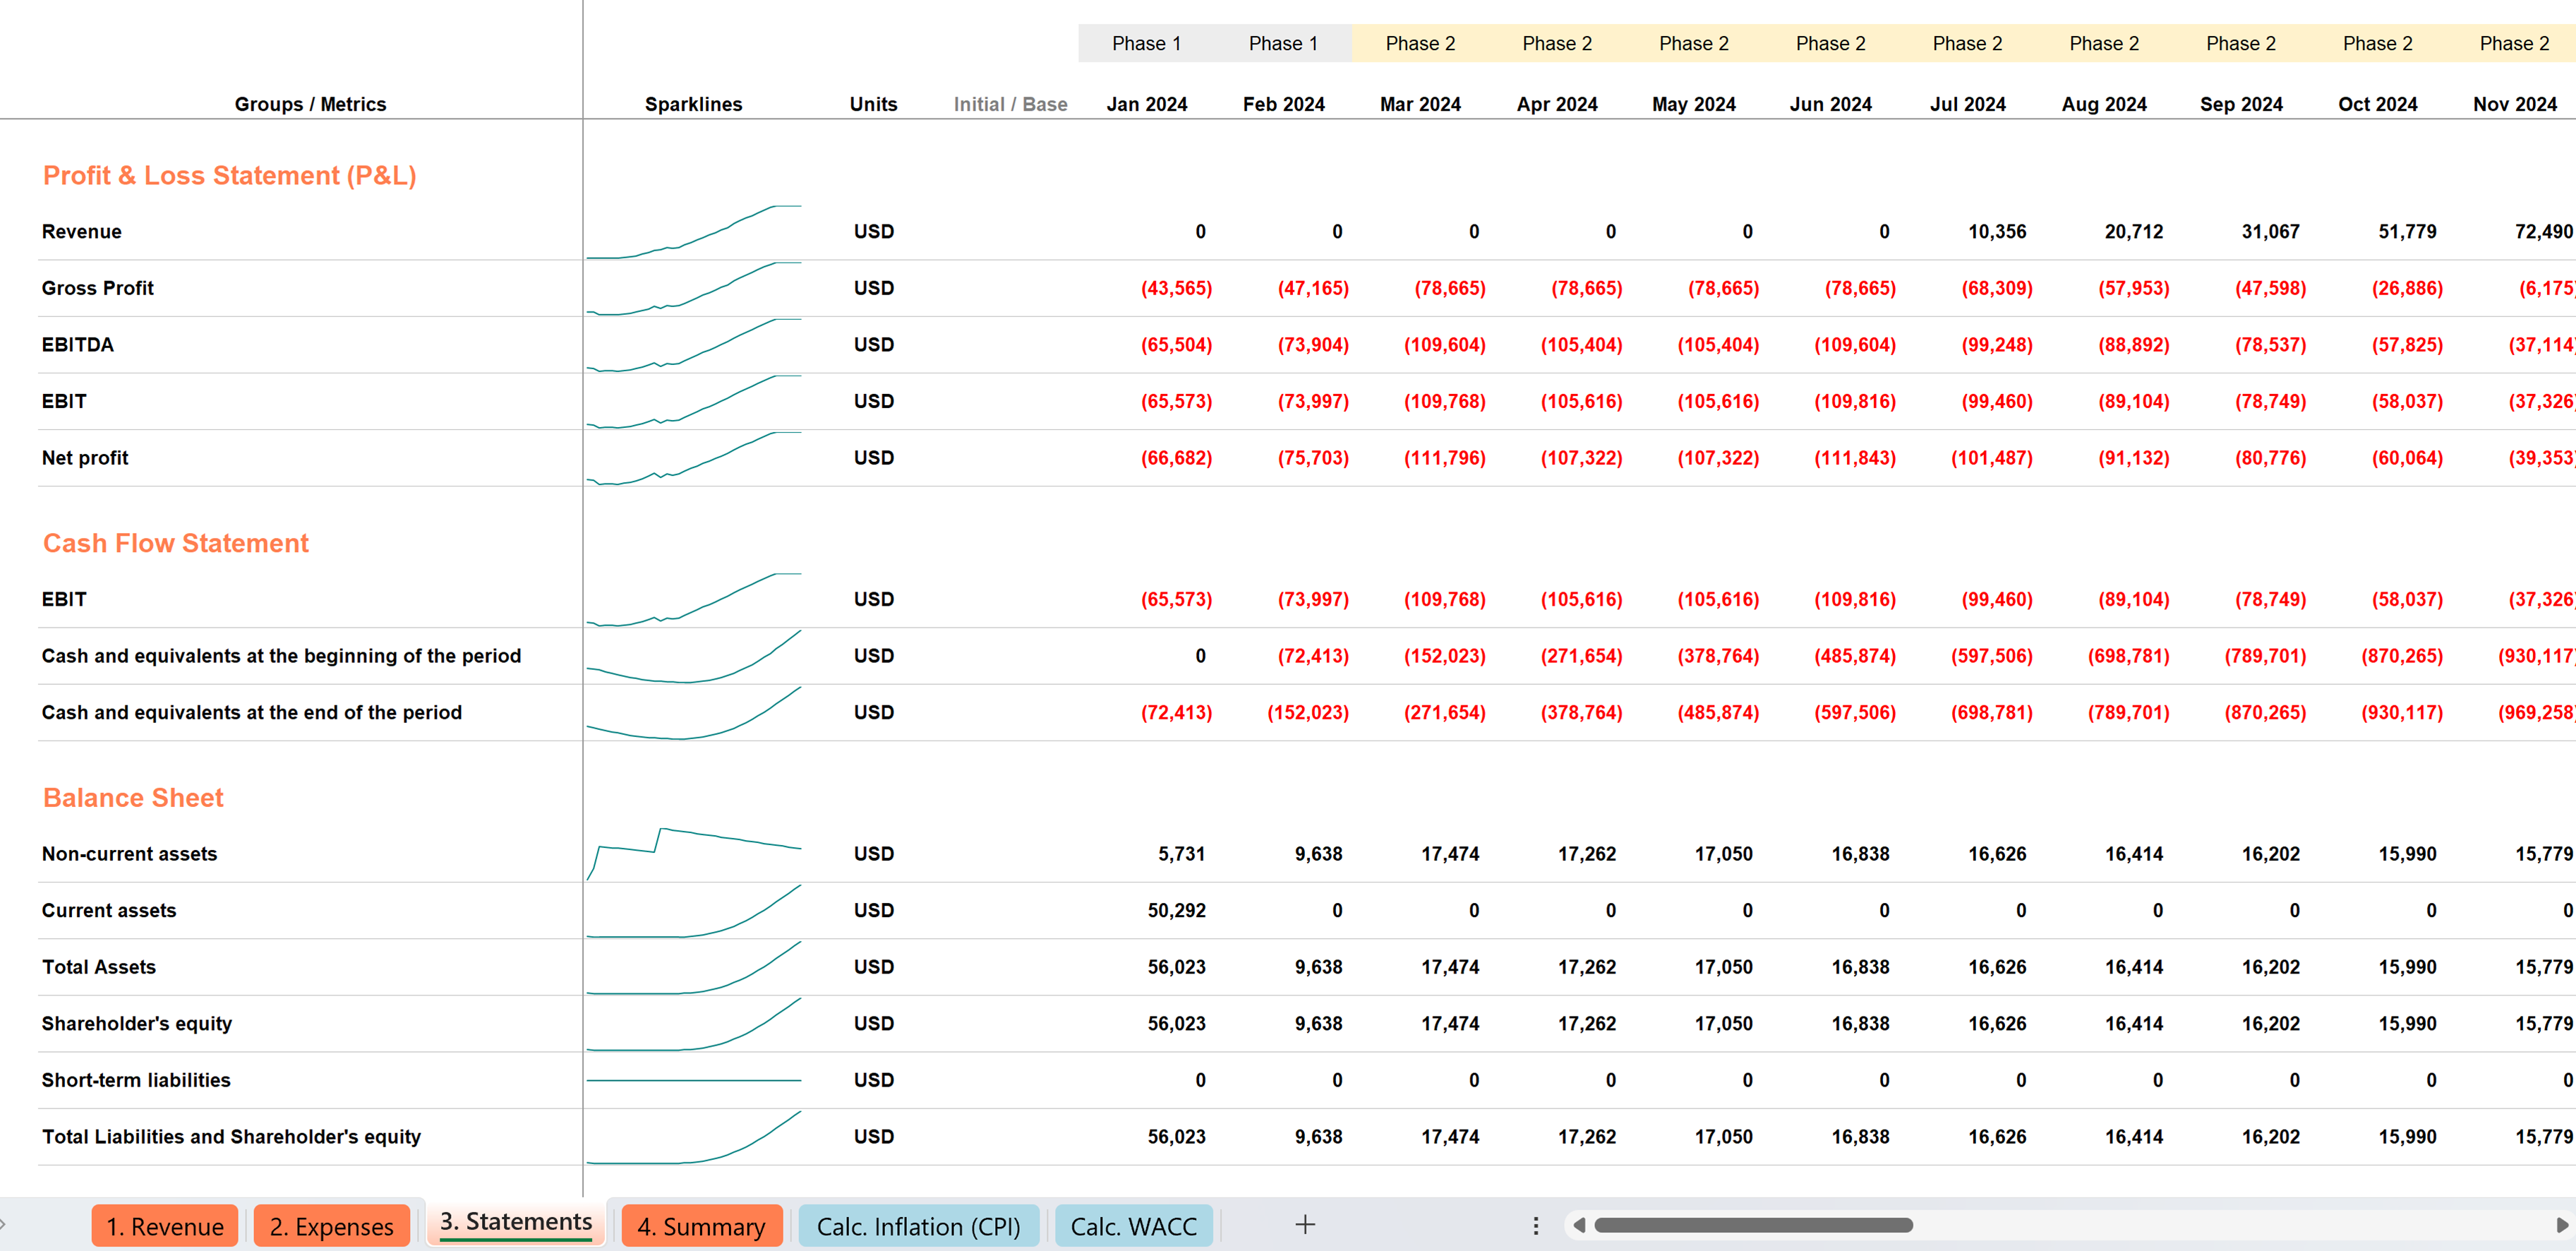
This sheet integrates the forecasts from the revenue and expense sheets into the three core financial statements:
- Profit and Loss
- Cash Flow
- Balance Sheet
Summary
This is the main analytical dashboard of the model. It combines headline investment metrics, scenario analysis, valuation visuals, and supporting operating indicators in one place.
Supporting sheets
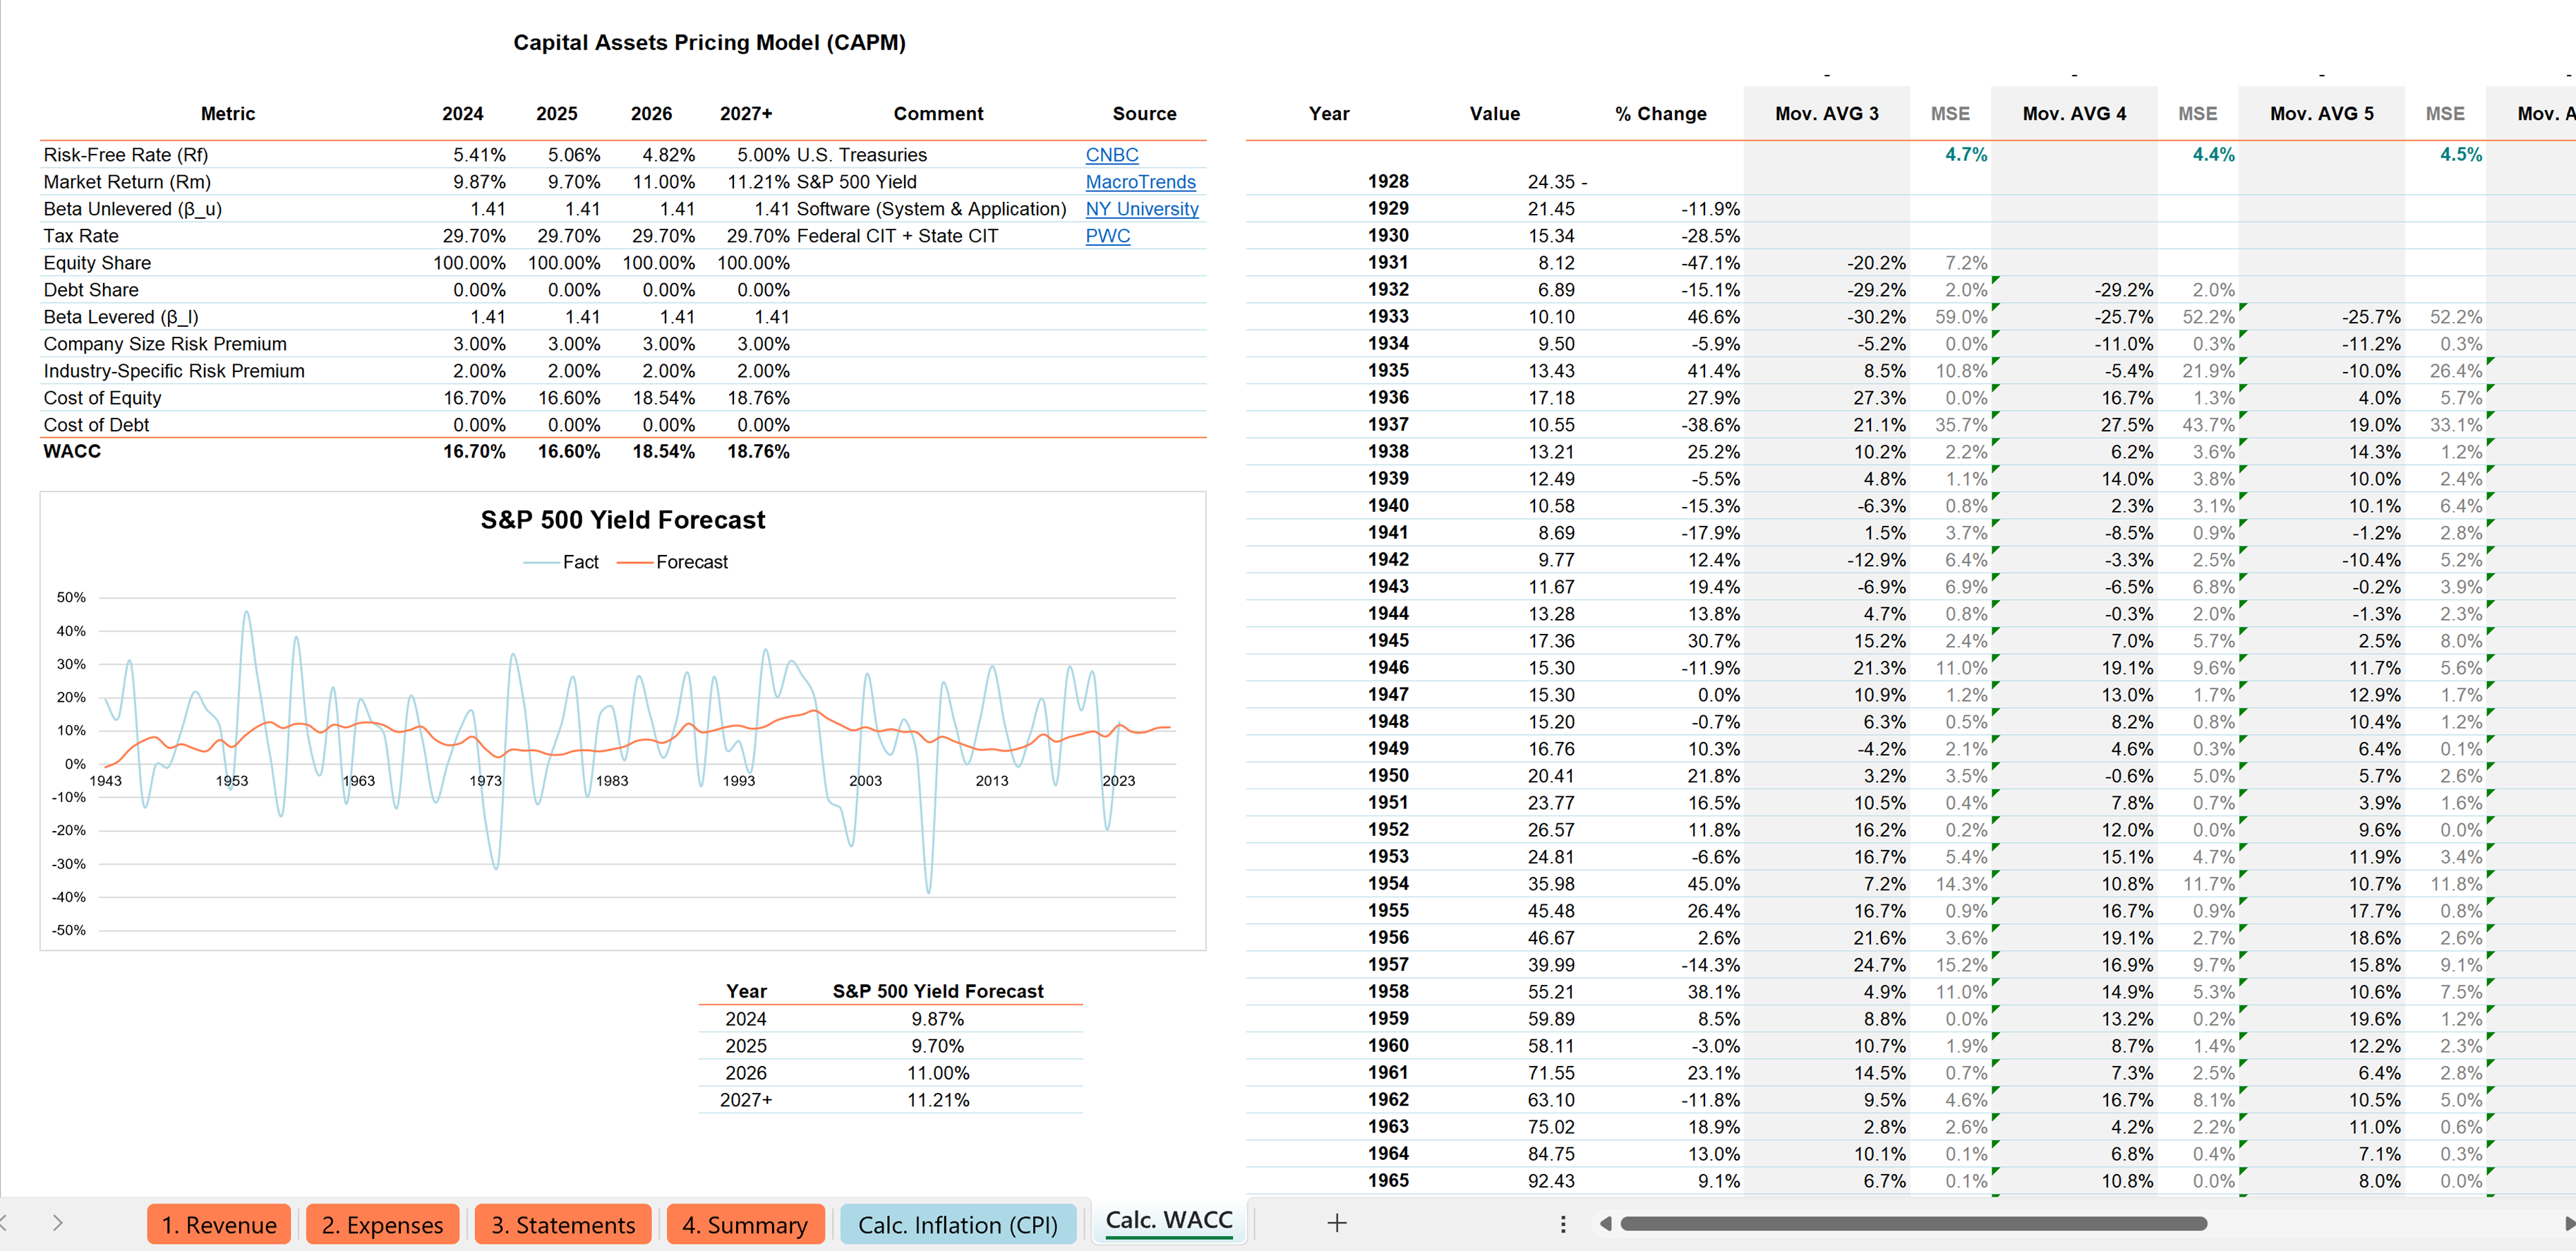
Additional sheets support CPI forecasting and WACC estimation under the CAPM framework. These tabs make the discount-rate logic transparent and allow the assumptions behind valuation to be tested rather than hard-coded.
💰 Financial Modeling Logic
The model translates business assumptions into projected financial statements and valuation outputs.
Revenue is forecast using both bottom-up and top-down logic, which helps validate the plausibility of the commercial outlook. Expenses are modeled in line with the operating reality of the startup and split into fixed and variable cost components.
These inputs feed into the projected P&L, Cash Flow, and Balance Sheet, which form the basis for investment analysis. The model then calculates the key decision metrics used to assess project attractiveness: Net Present Value (NPV), Internal Rate of Return (IRR), and Discounted Payback Period (DPP).
Because the model includes both an explicit forecast period and a post-forecast period, it provides a more complete view of long-term value creation.
📈 Forecasting and Valuation Inputs
A distinctive part of the model is the statistical treatment of selected valuation inputs.
For both CPI and Market Return, I first tested a linear regression approach and determined that it was not appropriate because of low R-squared and weak statistical significance. This indicated that the series behaved more like stationary time series.
I then compared alternative moving average and exponential smoothing models and selected the best-performing specification for each input based on Mean Square Error. These forecasts were then used in the WACC calculation under the CAPM framework.
This approach made the discount-rate assumptions more analytical and defensible than relying on a single manually chosen estimate.
🔀 Scenario Analysis
The Summary sheet includes a dynamic dropdown with three scenarios:
- Blue Sky
- Grey Sky
- Stormy Weather
When a user changes the selected scenario, the model automatically updates the dashboard visuals and key calculations. This makes it possible to compare how business viability changes under optimistic, base, and adverse conditions without rebuilding the model manually.
✨ Analytical Features
Investment metrics dashboard
The dashboard highlights the main project efficiency indicators at the top of the Summary sheet:
- NPV
- IRR
- DPP
- projected market share
These indicators provide an immediate view of the startup’s investment attractiveness under the selected scenario.
Dynamic gauge chart
A custom Excel gauge chart compares WACC and IRR, making it easier to judge whether the project exceeds the required return threshold.
NPV-to-WACC sensitivity analysis
The model includes a sensitivity chart showing how NPV changes as WACC changes in 2% increments. This gives decision-makers a clearer understanding of how robust the valuation is to discount-rate assumptions.
Customer Lifetime Value segmentation
The model also calculates Customer Lifetime Value for several user categories of the mobile application:
- glancers
- thinkers
- doers
- improvers
- parents 2.0
This adds a marketing and customer-economics layer to the financial analysis.
Dual display modes
Each major sheet includes two display modes, a key view and a detailed view, implemented entirely with formulas and no macros. This improves usability for both executive review and deeper analysis.
Visualization enhancements
The workbook uses sparklines, color coding, and dynamic links to key source information to make the model easier to navigate and interpret.
🔁 Reusability
An important design goal was reusability. The model was built not as a one-off spreadsheet, but as a structured template that can be adapted for other startup and investment cases.
That makes it useful not only as a valuation tool for this project, but also as a scalable framework for similar commercial and investment analysis tasks.
✅ Outcome
The final model did more than estimate the startup’s financial potential. It organized assumptions, forecasts, statements, and valuation logic into a single decision-support system.
As a result, the startup team was able to evaluate commercial viability, compare alternative scenarios in a few clicks, and use the results to support strategic management decisions. The fact that the model was built in Excel also made it practical and accessible for stakeholders, since Excel remains the most universal tool for financial analysis.