Timber Logistics Stock-on-Hand Forecasting Dashboard
This project presents a Power BI dashboard for dynamic short-term stock forecasting across timber transportation phases.
Download .pbix file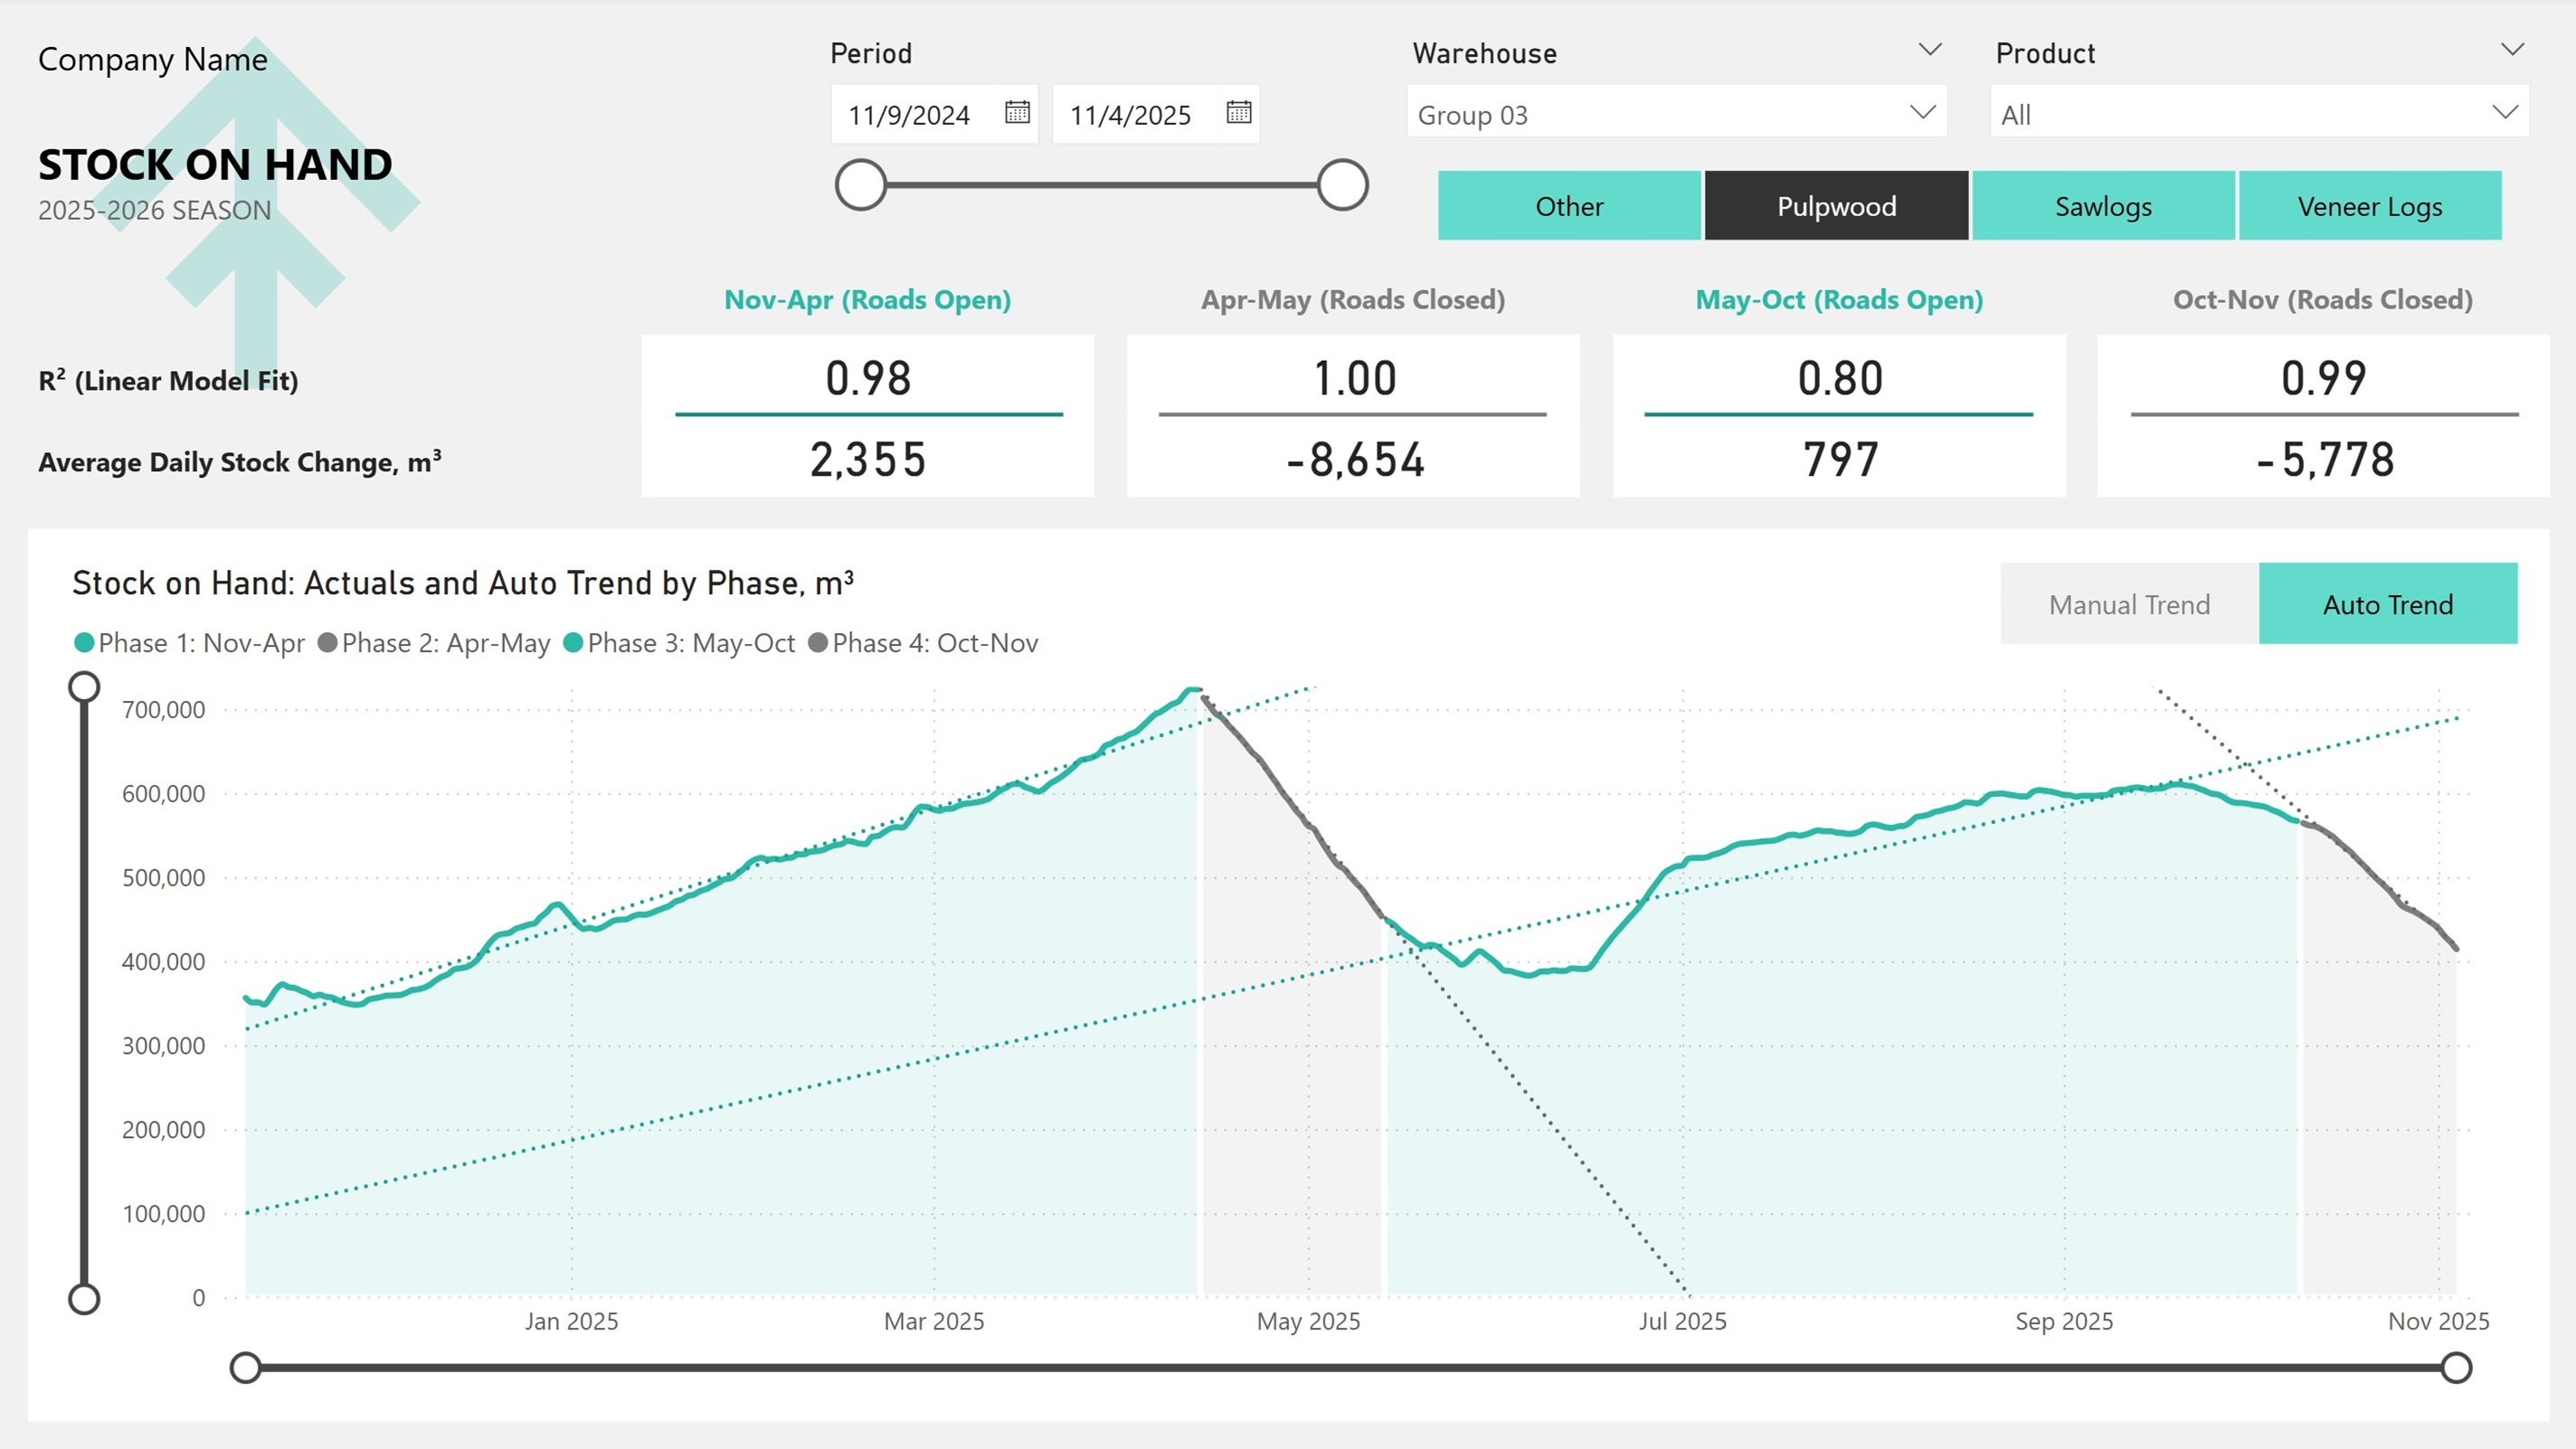
📌 Overview
This Power BI dashboard supports dynamic stock-on-hand forecasting across timber transportation phases for a large forestry holding company. It helps logistics managers evaluate short-term inventory trends, test how well a linear model fits observed stock dynamics, and estimate when inventory may run out under the currently selected conditions.
👤 My Role
I completed this project end to end, including business requirements gathering, dashboard development, data pipeline setup, testing, deployment, user training, and ongoing support for user requests.
🛠️ Tool Stack
Power BI, Power Query, DAX, ERP report exports, SFTP-based data ingestion, centralized dimension tables, parameter tables, hierarchical slicers, custom buttons, and statistical validation measures for linear trend analysis.
🎯 Business Problem
The company operates more than a thousand warehouses across multiple regions. Its ERP system stores current stock-on-hand balances by many dimensions, including wood species, assortment type, business unit, and other operational attributes. However, effective inventory management requires forecasting rather than static reporting.
The company already had a broader ML-based forecasting system, but it was not flexible enough for short-term operational planning. Logistics managers needed a tool that would let them quickly select the relevant filters, rebuild the forecast on the fly, and assess short-term inventory behavior over the next one to two weeks.
A key operational pattern was that the transportation year is divided into four phases: two active hauling phases and two road-drying phases with restricted transportation. During these periods, stock levels often follow a roughly linear upward or downward pattern depending on warehouse type and other business conditions. The challenge was that these trend shifts do not always start exactly on the official phase boundaries, so manual date-range selection was a critical requirement.
🗂️ Data Source
The original solution is based on stock-on-hand reports exported from the company’s corporate ERP system. Daily report extracts were delivered to an SFTP location and connected to Power BI as the reporting source.
For portfolio purposes, the showcased version uses a redacted dataset connected to a GitHub-hosted table instead of the live corporate source, so the project structure and analytical logic can be demonstrated without exposing confidential business data.
🔄 Data Preparation
The main preparation work was not conventional data cleaning, but aligning the dataset with business rules and operational reality. I worked directly with users to clarify how stock values were recorded in the ERP report and how those values should be interpreted in analysis.
For example, negative stock changes were considered valid because they reflected same-day recount adjustments. Blank values were treated as user-entry gaps, but they were not allowed to distort total volume calculations. No abnormal extreme values were identified, and the categorical variables were already standardized in the source process.
I also coordinated with IT to establish the SFTP-based delivery pipeline because API access was not available at that time and SFTP was the company’s standard integration approach. The extract was refreshed daily, and the previous month’s data was overwritten once per month to reflect post-factum corrections made in the ERP system.
🧩 Data Model
This dashboard was built as part of a broader inventory and logistics reporting environment for the company’s timber supply function. The stock table was integrated with centralized reference data, including a calendar table, warehouse geodata, and other shared dimensions.
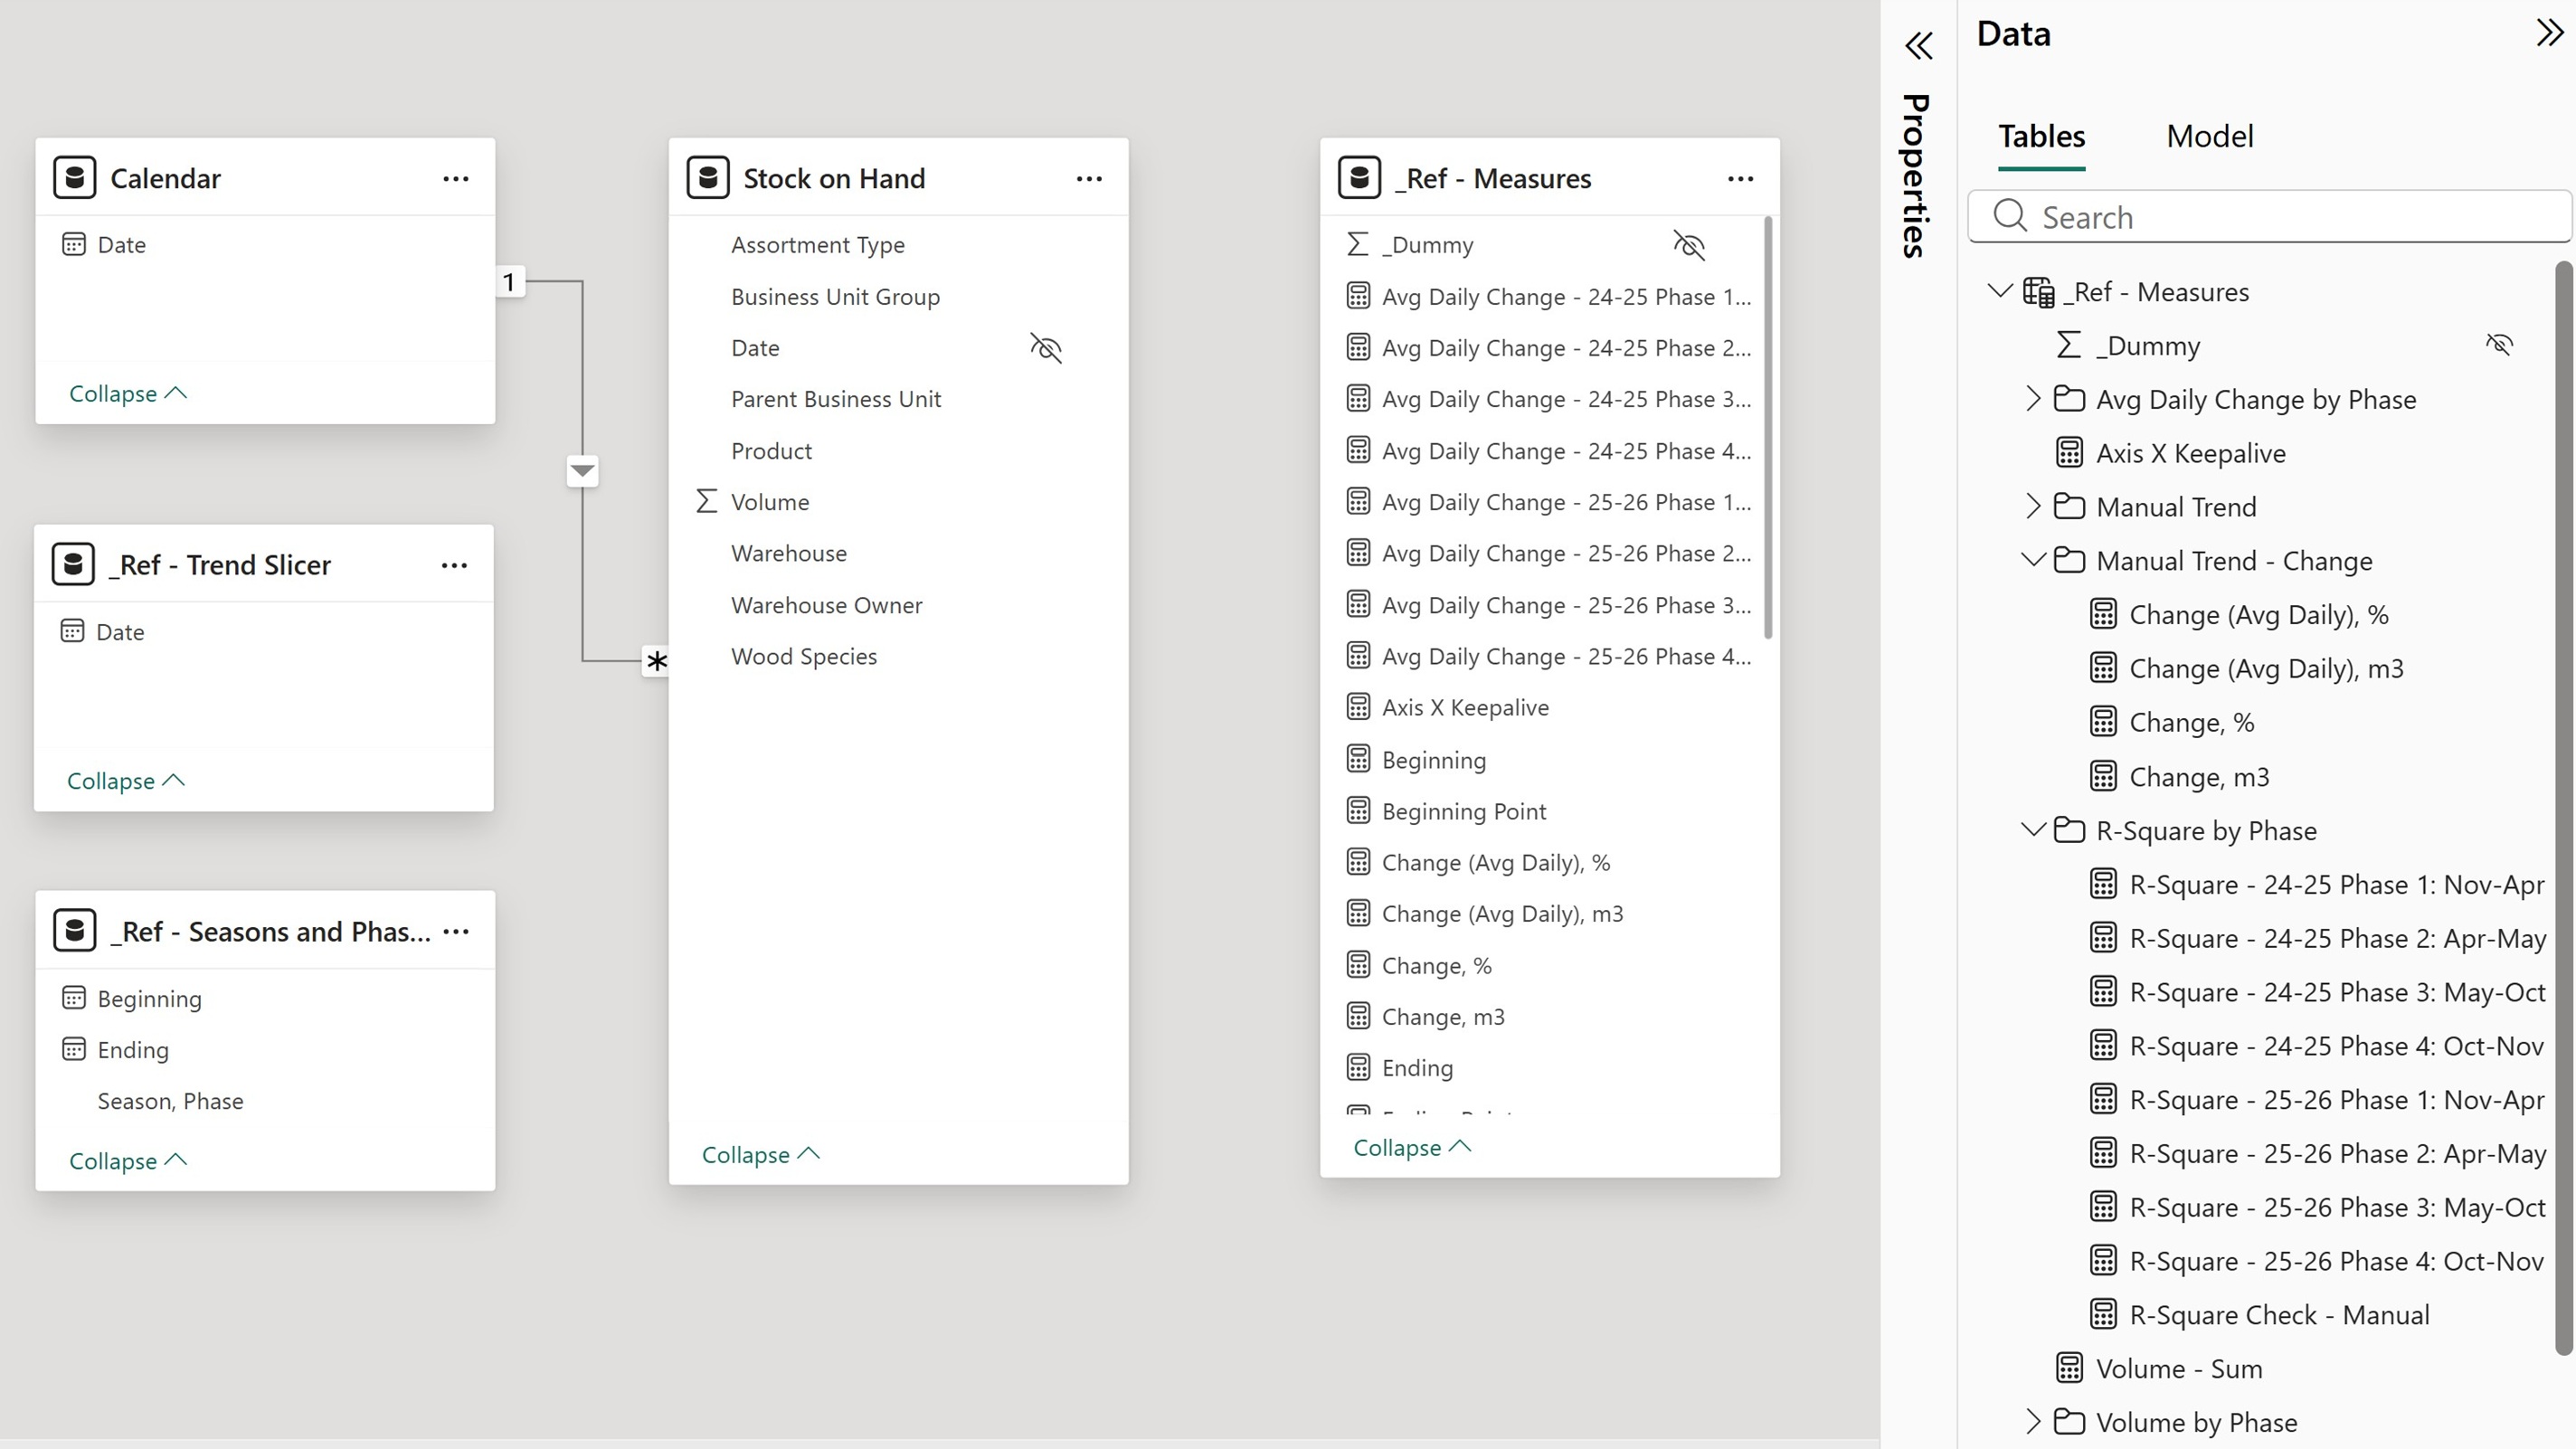
For this specific use case, I added two dedicated helper tables. The first was a custom date table used to define manual date ranges for trend calculation within the broader period selected on the main date slicer. The second was a phase-boundary reference table used to identify the four transportation phases within each timber season.
To keep the model maintainable, all measures were stored in a dedicated measures table and organized into folders.
✨ Dashboard Features
Season-based report structure
The dashboard is organized into separate pages, each representing a timber transportation season starting in November. Each season is split into four logistics phases: November to April and May to October as active transportation periods, plus April to May and October to November as road-drying periods with limited hauling activity.
Hierarchical business filters
The report includes dynamic filters for time period, warehouses, and products. The warehouse and product filters are built with multi-level hierarchies so users can move easily between broad operational groups and detailed slices. Assortment type is highlighted separately through large button-based selectors for faster interaction.
Dual trend-analysis modes
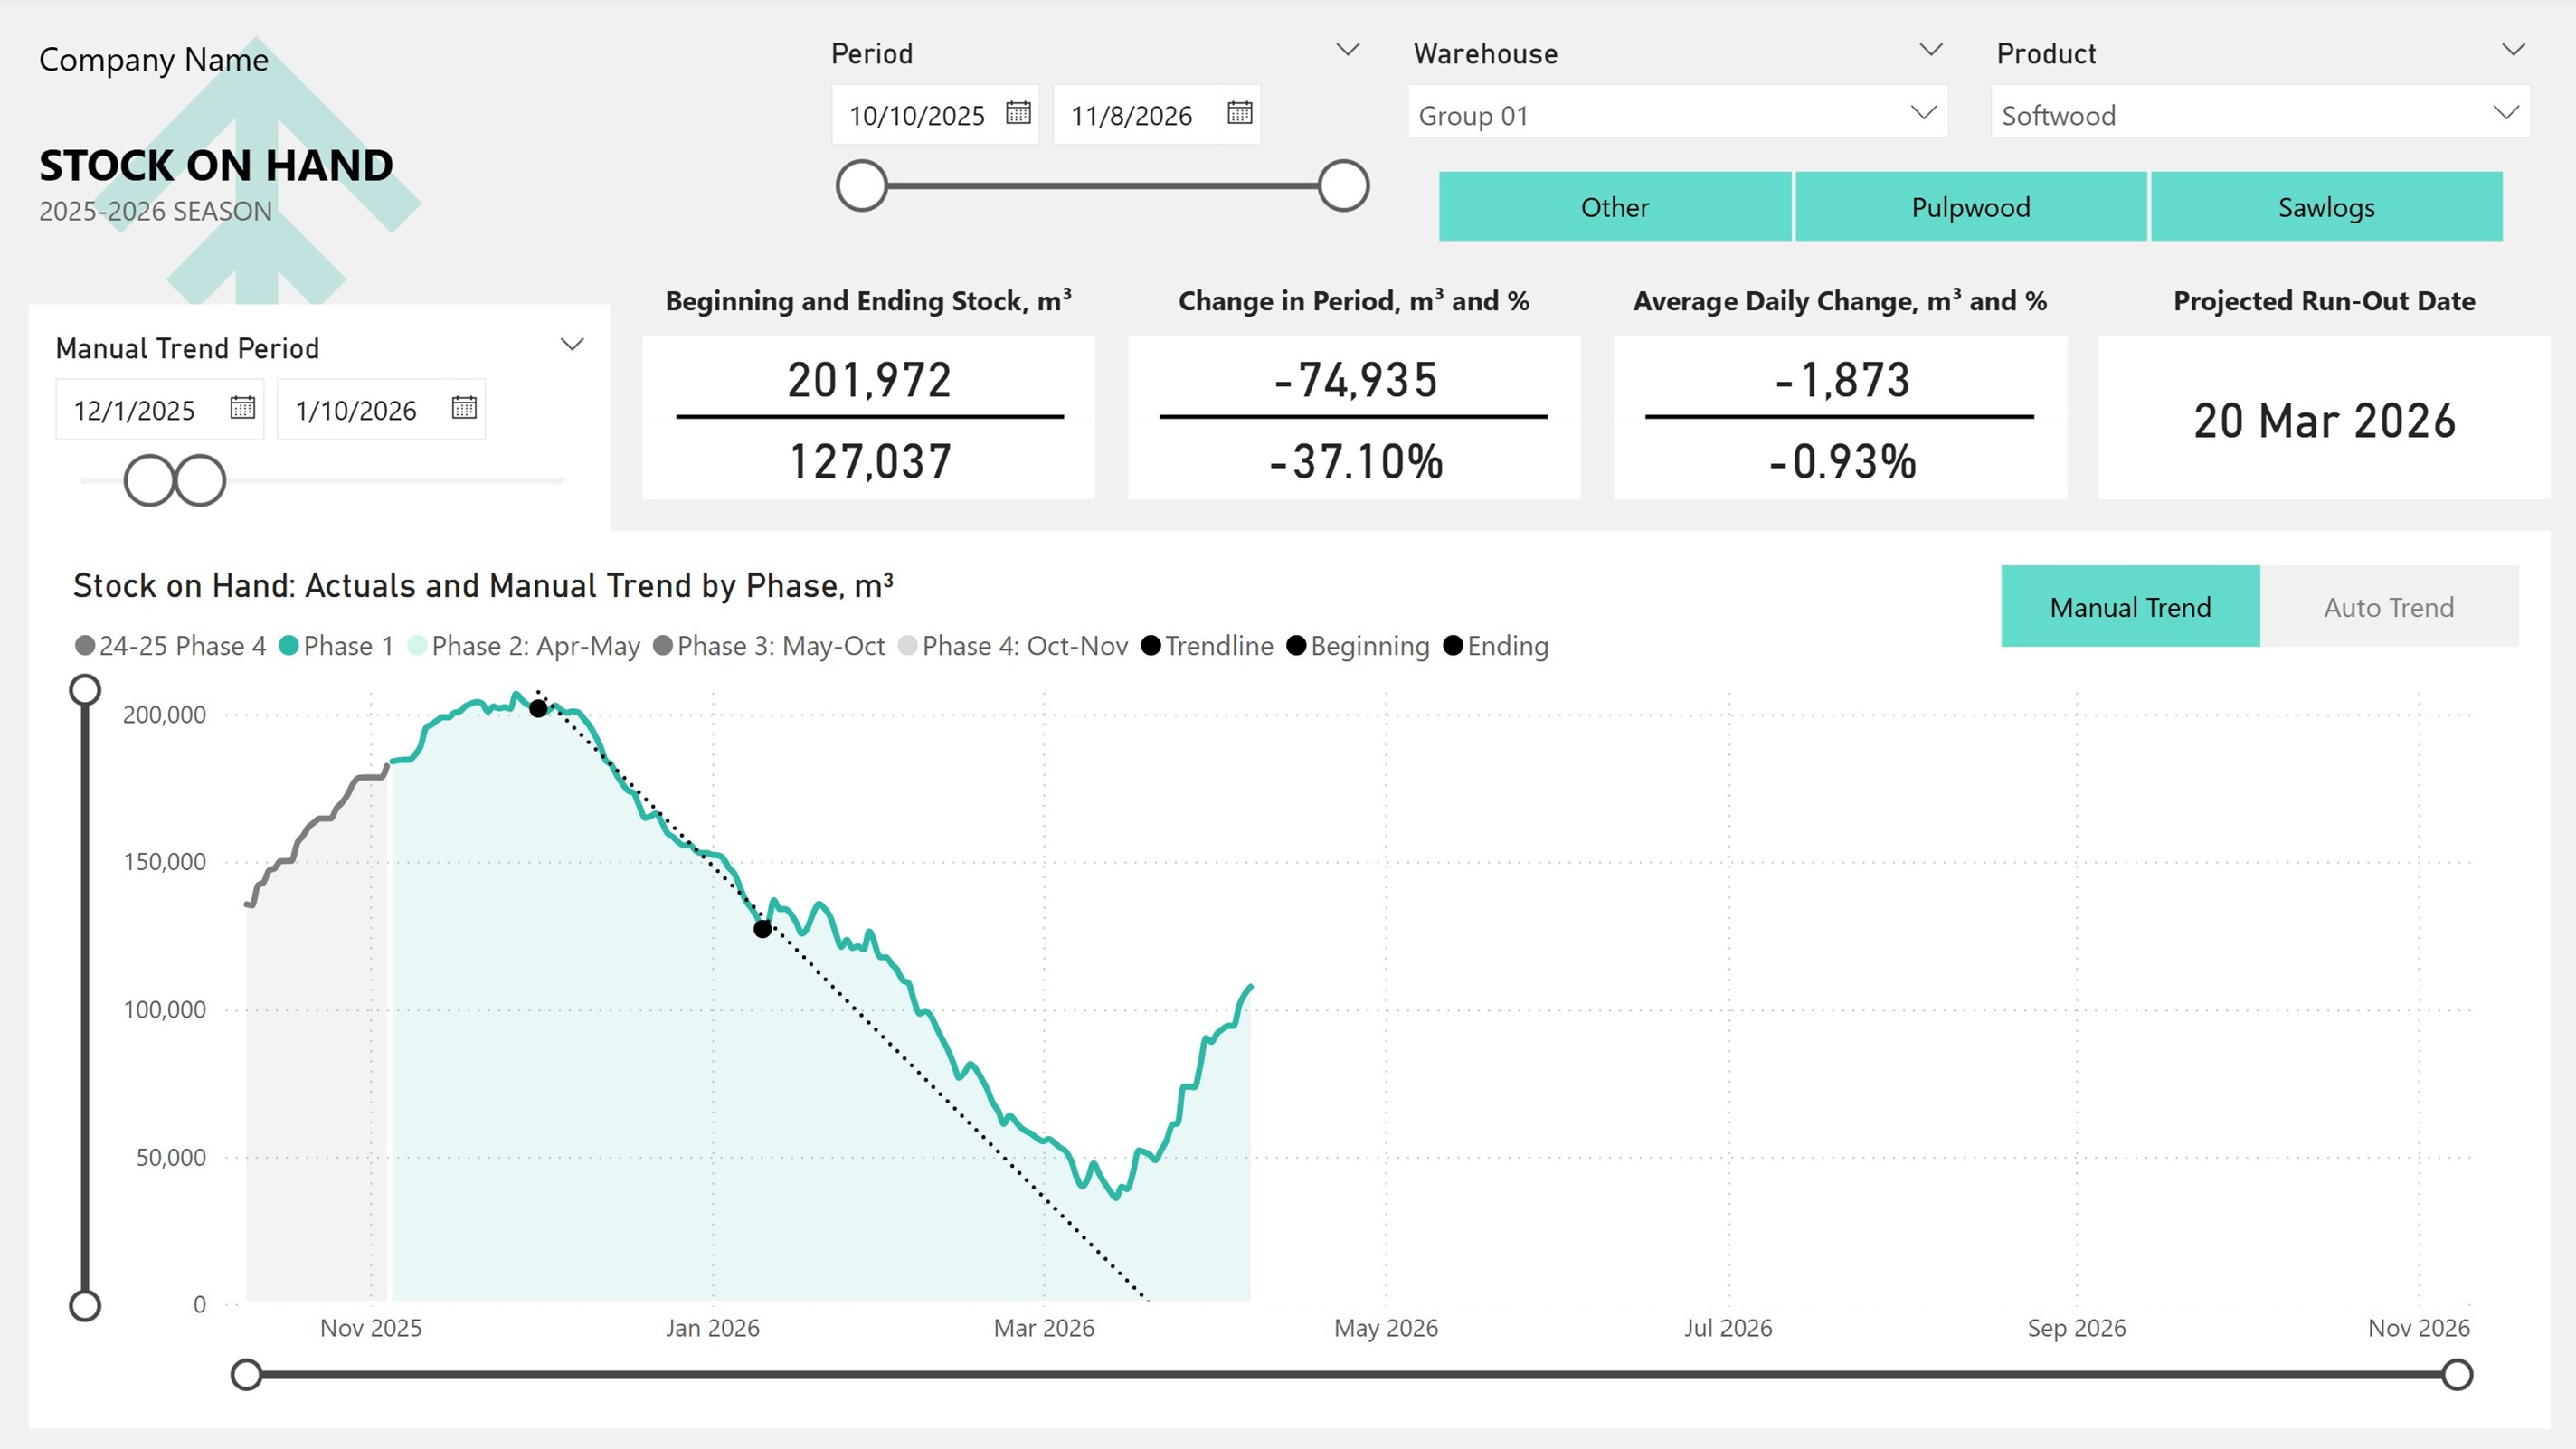
The core visual is a daily stock-on-hand time series chart. To match the business need, the report supports two primary modes: automatic phase-based trend analysis and manual trend analysis across a user-defined date range. Users switch between these modes with buttons placed directly on the chart area.
In auto trend mode, the chart displays stock values across the four transportation phases and overlays a separate linear trend line for each phase when sufficient data is available. In manual trend mode, the chart still shows the daily actual stock values, but only one trend line is displayed, calculated from the custom date range selected through a dedicated date slicer visible only in that mode.
Built-in linear model quality validation
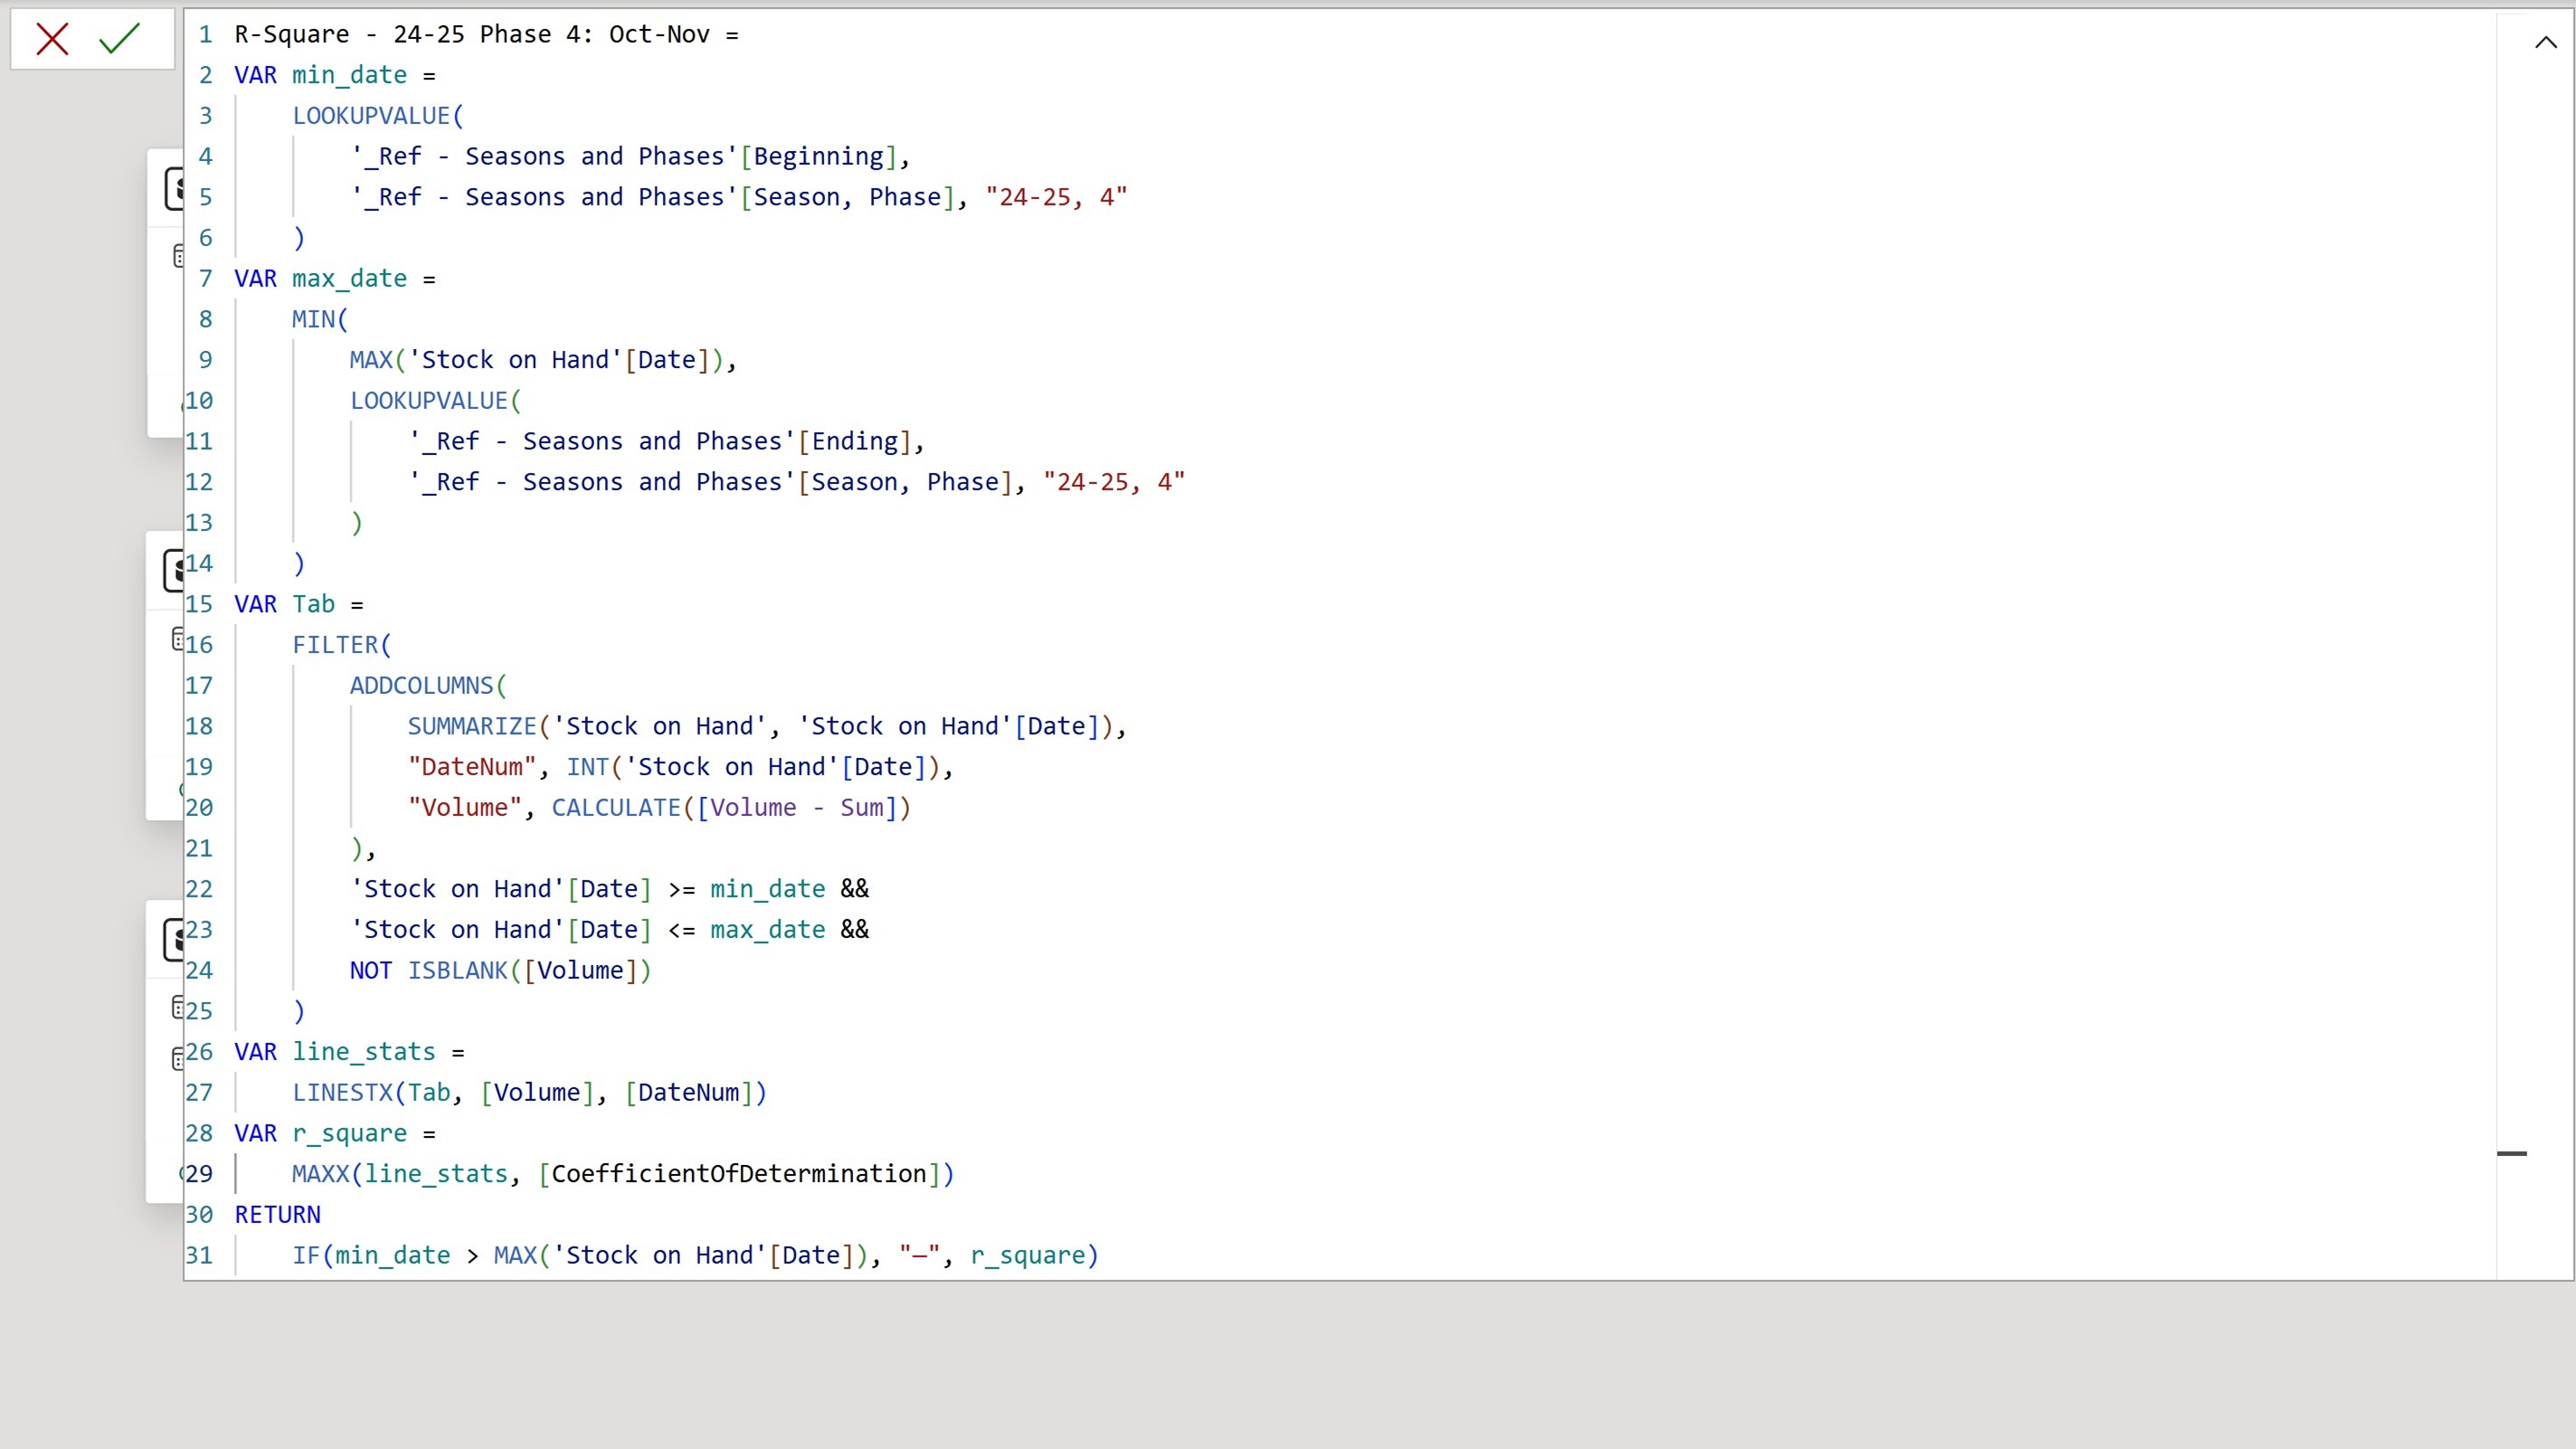
A distinctive feature of the dashboard is that it does not only display a linear trend, but also evaluates how well that trend fits the observed time series. In auto trend mode, R-squared values are shown for each phase. Values closer to 1 indicate that the linear trend explains the observed pattern well, while values closer to 0 indicate a weak fit.
To complement that, the dashboard also shows average daily stock change for each phase so users can quickly understand the direction and intensity of inventory movement.
Operational planning metrics in manual mode
For manual trend analysis, I added several additional metrics requested by users: beginning stock, ending stock, stock change during the selected period, and average daily stock change.
The most important of these is the projected run-out date. When the selected filters produce a declining stock trend, the dashboard calculates the theoretical date at which inventory would reach zero. If the selected trend is flat or positive, the run-out date is not shown.
🔍 Key Insights
- The dashboard recalculates linear trends immediately when users change one or more slicers, making it useful for fast operational scenario analysis.
- Logistics managers can review trends by phase or by custom period and compare short-term stock behavior with medium- and long-term plans.
- The tool supports operational decisions such as moving timber between warehouses or requesting additional transportation capacity.
- Because the filters support analysis at multiple levels, the report improves planning for central logistics leadership, regional teams, warehouse groups, and individual warehouses across a network of several thousand locations.
🚧 Limitations and Future Improvements
There are several clear directions for extending the project:
- evaluate non-linear forecasting trends in addition to linear models
- expand the retrospective analysis across multiple years with explicit seasonality handling
- replace the SFTP-based pipeline with direct ERP API connectivity
- add three-zone color coding for R-squared values, with threshold boundaries at 0.5 and 0.8
These improvements would make the solution more robust, more scalable, and more actionable for both short-term and broader planning use cases.